Cornwall: Fire Incidents, New York (NY)
Where are fire incidents reported in Cornwall, NY
Something went wrong! Please refresh the page.
|
| |||||||||||||||||||||||||||||||||||||||||||||||||||||||||||||||||||||||||||||||||||||||||||||||||||||||||||||
2002 - 2018 National Fire Incident Reporting System (NFIRS) incidents
- Incident types reported to NFIRS in Cornwall, NY
- 1,01843.3%Hazardous Condition
- 44619.0%False Alarm
- 34714.8%Fire
- 23910.2%Rescue & EMS
- 1536.5%Good Intent Call
- 1416.0%Service Call
- 30.1%Overpressure Rupture
- Fire incident types reported to NFIRS in Cornwall, NY
- 18653.6%Structure Fires
- 9326.8%Outside Fires
- 4914.1%Mobile Property/Vehicle Fires
- 195.5%Other
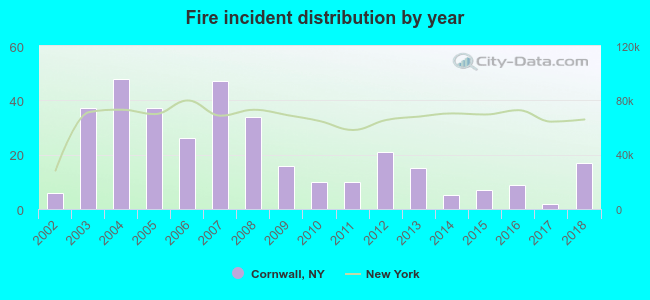 According to the data from the years 2002 - 2018 the average number of fires per year is 20. The highest number of fire incidents - 48 took place in 2004, and the least - 2 in 2017. The data has an increasing trend.
The average number of yearly fire incidents per 10k residents in Cornwall, NY compared to nearest cities:
(Note: Based on data for the last 3 years, including only cities with population 5,000 and above)
| Cornwall: | 7.4 |
| New Windsor: | 76.2 |
| Newburgh: | 65.5 |
| Washingtonville: | 29.9 |
| Philipstown: | 2.1 |
| Beacon: | 38.4 |
| Blooming Grove: | 4.8 |
| Kiryas Joel: | 1.2 |
| Monroe: | 267.1 |
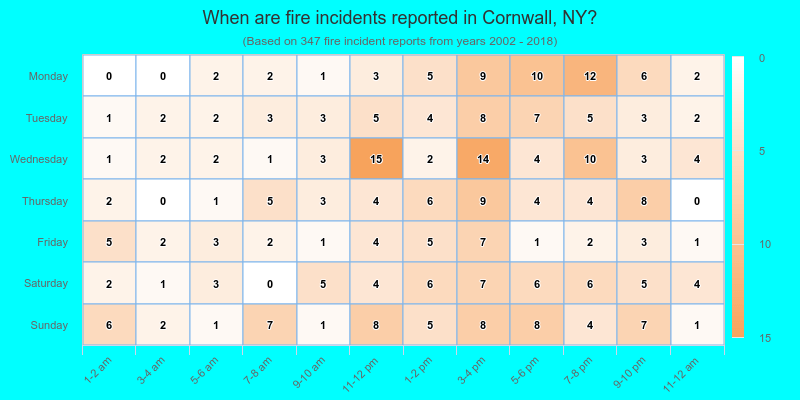
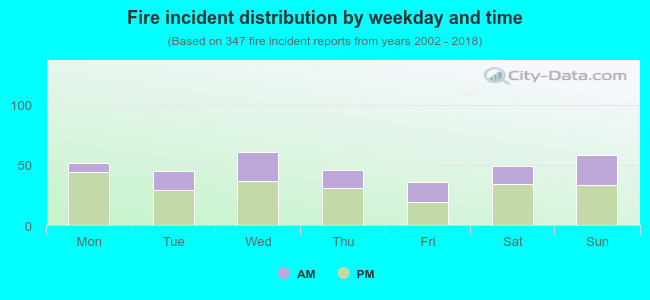 34.6% incidents where reported in the morning and 65.4% in the evening. The most fires (17.6%) took place on Wednesday, and the least (10.4%) on Friday.
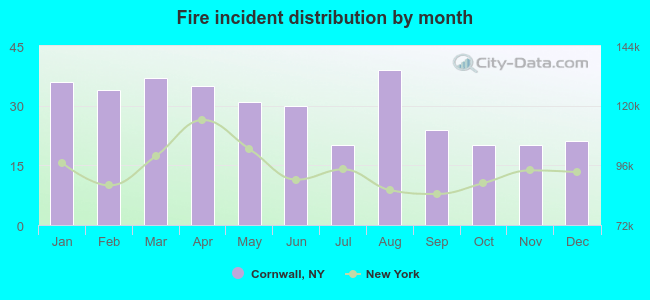 According to the 347 fires from years 2002 - 2018 most fires (11.2%) took place during August, and the least (5.8%) in July.
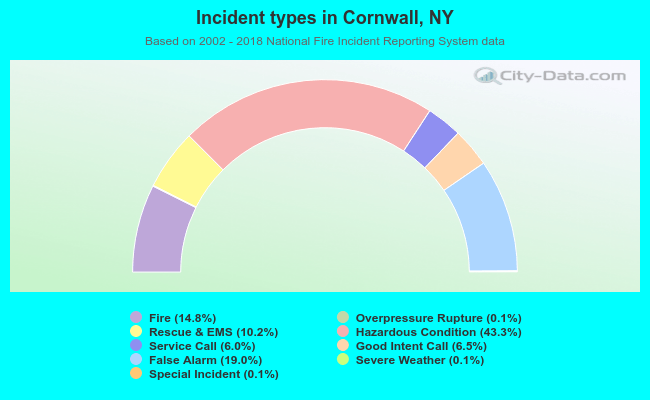 Out of all 2,351 cases reported during the years 2002 - 2018, the most belonged to the categories: Hazardous Condition (43.3%), False Alarm (19.0%), and Fire (14.8%).
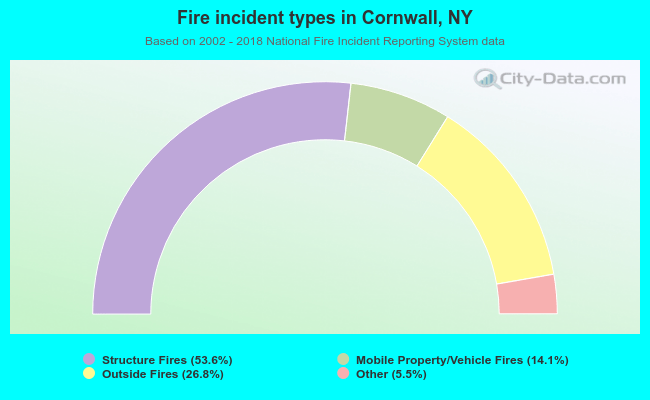 When looking into fire subcategories, the most incidents belonged to: Structure Fires (53.6%), and Outside Fires (26.8%).