Bloomington: Fire Incidents, Indiana (IN)
Where are fire incidents reported in Bloomington, IN
Something went wrong! Please refresh the page.
| Fire incidents reported | |
|---|---|
| Sreet name | Count |
| 3RD ST | 412 |
| WALNUT ST | 386 |
| 10TH ST | 308 |
| STATE ROAD 46 HWY | 238 |
| STATE ROAD 45 HWY | 232 |
| CURRY PIKE | 224 |
| LEONARD SPRINGS RD | 182 |
| ROGERS ST | 182 |
| VERNAL PIKE | 166 |
| ROCKPORT RD | 164 |
| JORDAN AVE | 154 |
| KIRKWOOD AVE | 128 |
| STATE RD 37 | 128 |
| WALNUT STREET PIKE | 124 |
| COLLEGE AVE | 108 |
| STATE ROAD 45 | 106 |
| HARTSTRAIT RD | 104 |
| LINCOLN ST | 102 |
| WASHINGTON ST | 102 |
| DUNN ST | 98 |
| UNION ST | 98 |
| 7TH ST | 94 |
| GARRISON CHAPEL RD | 92 |
| 2ND ST | 88 |
| FAIRFAX RD | 86 |
| 11TH ST | 84 |
| MADISON ST | 84 |
| STATE ROAD 48 HWY | 84 |
| OLD SR 37 HWY | 82 |
| 17TH ST | 78 |
| Other | 3,753 |
2002 - 2017 National Fire Incident Reporting System (NFIRS) incidents
- Incident types reported to NFIRS in Bloomington, IN
- 9,44531.7%Rescue & EMS
- 8,27127.8%Fire
- 6,06220.4%Hazardous Condition
- 2,7089.1%False Alarm
- 1,8066.1%Good Intent Call
- 9753.3%Service Call
- 4201.4%Special Incident
- 520.2%Overpressure Rupture
- 450.2%Severe Weather
- Fire incident types reported to NFIRS in Bloomington, IN
- 3,99048.2%Outside Fires
- 2,82834.2%Structure Fires
- 1,02212.4%Mobile Property/Vehicle Fires
- 4315.2%Other
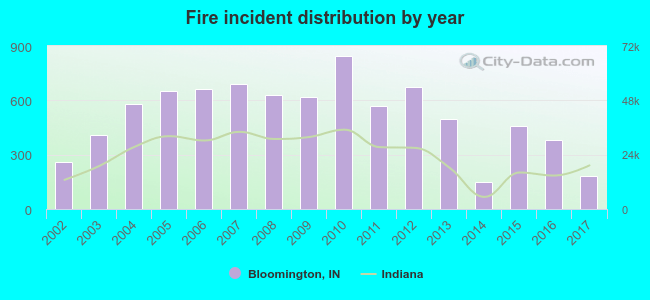 According to the data from the years 2002 - 2017 the average number of fires per year is 516. The highest number of reported fire incidents - 844 took place in 2010, and the least - 148 in 2014. The data has a declining trend.
The average number of yearly fire incidents per 10k residents in Bloomington, IN compared to nearest cities:
(Note: Based on data for the last 3 years, including only cities with population 5,000 and above)
| Bloomington: | 23.2 |
| Ellettsville: | 28.3 |
| Martinsville: | 76.9 |
| Bedford: | 44.7 |
| Bargersville: | 39.2 |
| Mooresville: | 102.3 |
| Columbus: | 37.4 |
| Franklin: | 20.0 |
| Linton: | 11.3 |
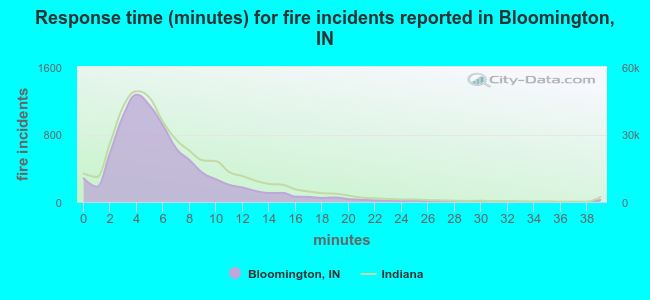 The median response time based on all reported fire incidents is 5 minutes. This is lower compared to the Indiana median value.
The median response time in Bloomington, IN compared to nearest cities:
(Note: Based on data for all years, including only cities with at least 500 fire incidents)
| Bloomington: | 5 minutes |
| Ellettsville: | 6 minutes |
| Spencer: | 10 minutes |
| Nashville: | 12 minutes |
| Martinsville: | 8 minutes |
| Bedford: | 7 minutes |
| Bloomfield: | 10 minutes |
| Cloverdale: | 11 minutes |
| Mitchell: | 10 minutes |
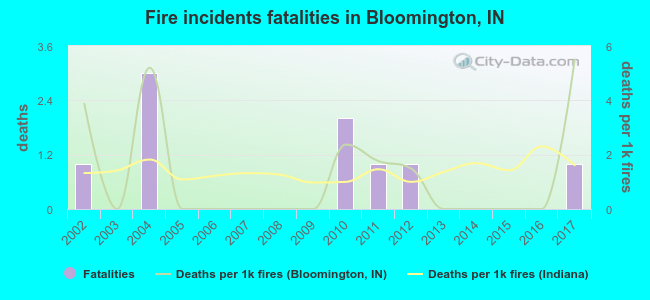 Based on the data from the years 2002 - 2017 the average number of fire-related fatalities per year is 1. The highest number of reported deaths - 3 took place in 2004, and the lowest - 0 in 2003. The data has a constant trend.
The average number of deaths per 1,000 fires is 1. This indicator was the highest - 5 in 2017, and the lowest 0 in 2003. The trend for deaths per 1,000 incidents is growing. Compared to the Indiana value the number of deaths per 1,000 fires is lower.
Based on the data from the years 2002 - 2017 the average number of fire-related fatalities per year is 1. The highest number of reported deaths - 3 took place in 2004, and the lowest - 0 in 2003. The data has a constant trend.
The average number of deaths per 1,000 fires is 1. This indicator was the highest - 5 in 2017, and the lowest 0 in 2003. The trend for deaths per 1,000 incidents is growing. Compared to the Indiana value the number of deaths per 1,000 fires is lower.
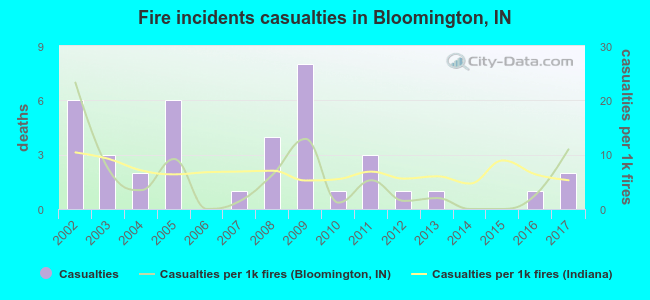 Based on the data from the years 2002 - 2017 the average number of fire-related casualties per year is 2. The highest number of reported injuries - 8 took place in 2009, and the lowest - 0 in 2006. The data has a dropping trend.
The average number of injuries per 1,000 fires is 5. This indicator was the highest - 23 in 2002, and the lowest 0 in 2006. The trend for injuries per 1,000 fire incidents is dropping. Compared to the Indiana value the number of casualties per 1,000 fires is lower.
Based on the data from the years 2002 - 2017 the average number of fire-related casualties per year is 2. The highest number of reported injuries - 8 took place in 2009, and the lowest - 0 in 2006. The data has a dropping trend.
The average number of injuries per 1,000 fires is 5. This indicator was the highest - 23 in 2002, and the lowest 0 in 2006. The trend for injuries per 1,000 fire incidents is dropping. Compared to the Indiana value the number of casualties per 1,000 fires is lower.Casualties per 1,000 incidents in Bloomington, IN compared to nearest cities:
(Note: Based on data for all years, including only cities with at least 500 fire incidents)
| Bloomington: | 4.7 |
| Ellettsville: | 2.0 |
| Spencer: | 2.5 |
| Nashville: | 4.3 |
| Martinsville: | 10.7 |
| Bedford: | 3.4 |
| Bloomfield: | 1.7 |
| Cloverdale: | 0.0 |
| Mitchell: | 0.0 |
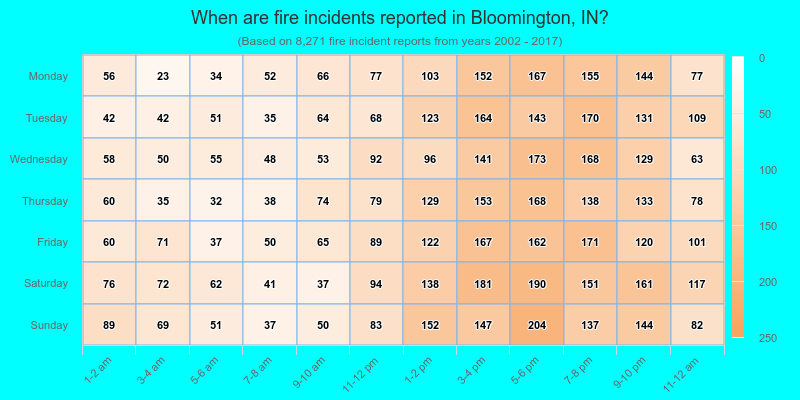
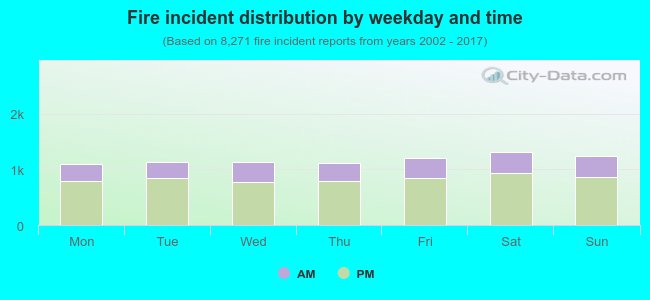 29.2% incidents where reported in the morning and 70.8% in the evening. The most fires (16.0%) took place on Saturday, and the least (13.4%) on Monday.
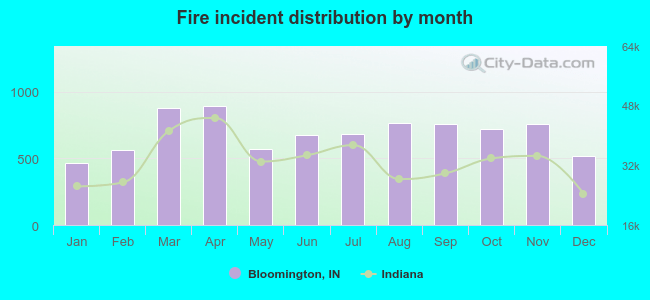 According to the 8,271 reports from years 2002 - 2017 most fires (10.8%) took place during April, and the least (5.6%) in January.
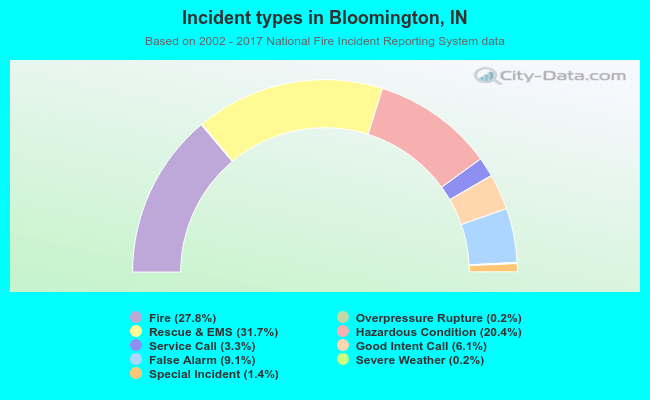 Out of all 29,784 cases reported during the years 2002 - 2017, the most belonged to the categories: Rescue & EMS (31.7%), Fire (27.8%), and Hazardous Condition (20.4%).
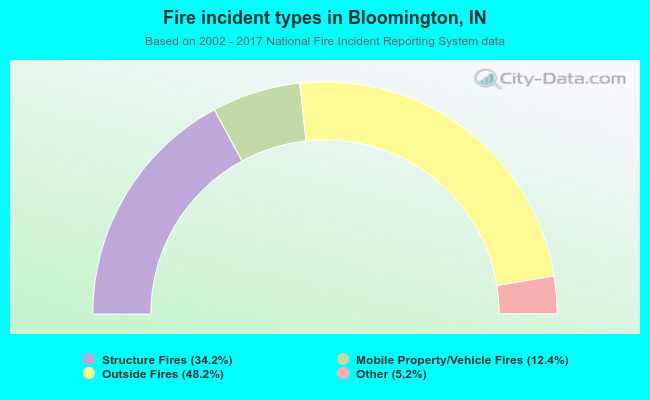 When looking into fire subcategories, the most incidents belonged to: Outside Fires (48.2%), and Structure Fires (34.2%).