Martinsville: Fire Incidents, Indiana (IN)
Where are fire incidents reported in Martinsville, IN
Something went wrong! Please refresh the page.
| Fire incidents reported | |
|---|---|
| Sreet name | Count |
| MAIN ST | 90 |
| MORGAN ST | 78 |
| HARRISON ST | 60 |
| PIKE ST | 56 |
| BEECH GROVE RD | 52 |
| OLD STATE ROAD 37 | 50 |
| BLUE BLUFF RD | 48 |
| CHERRY ST | 48 |
| WASHINGTON ST | 40 |
| OHIO ST | 38 |
| PARK AVE | 38 |
| RED DAY RD | 34 |
| COPE RD | 32 |
| EGBERT RD | 32 |
| WILBUR RD | 32 |
| COLUMBUS ST | 30 |
| STATE ROAD 37 | 30 |
| PARADISE DR | 28 |
| SR 37 HWY | 28 |
| DOUGLAS ST | 26 |
| GRAY ST | 26 |
| MORTON AVE | 26 |
| ROB HILL RD | 26 |
| STATE ROAD 39 HWY | 26 |
| CUNNINGHAM ST | 24 |
| HUGGIN HOLLOW RD | 24 |
| BAIN RD | 22 |
| BANTA RD | 22 |
| MAPLE GROVE RD | 22 |
| NEW HARMONY RD | 22 |
| Other | 1,135 |
2002 - 2018 National Fire Incident Reporting System (NFIRS) incidents
- Incident types reported to NFIRS in Martinsville, IN
- 5,58747.0%Rescue & EMS
- 2,24518.9%Fire
- 1,69114.2%Good Intent Call
- 1,63013.7%Hazardous Condition
- 3773.2%Service Call
- 2992.5%False Alarm
- 280.2%Severe Weather
- 210.2%Special Incident
- Fire incident types reported to NFIRS in Martinsville, IN
- 1,09548.8%Structure Fires
- 75233.5%Outside Fires
- 24911.1%Mobile Property/Vehicle Fires
- 1496.6%Other
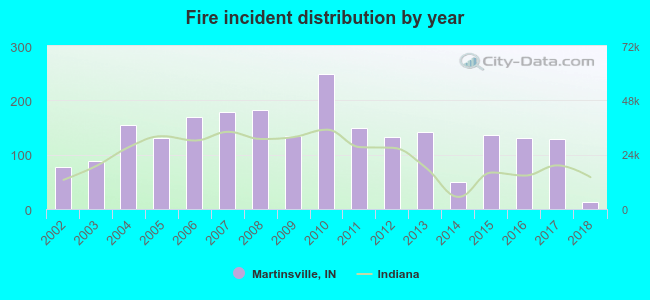 According to the data from the years 2002 - 2018 the average number of fire incidents per year is 132. The highest number of reported fire incidents - 249 took place in 2010, and the least - 12 in 2018. The data has a dropping trend.
The average number of yearly fire incidents per 10k residents in Martinsville, IN compared to nearest cities:
(Note: Based on data for the last 3 years, including only cities with population 5,000 and above)
| Martinsville: | 76.9 |
| Mooresville: | 102.3 |
| Bargersville: | 39.2 |
| Ellettsville: | 28.3 |
| Bloomington: | 23.2 |
| Plainfield: | 9.8 |
| New Whiteland: | 22.9 |
| Franklin: | 20.0 |
| Greenwood: | 12.8 |
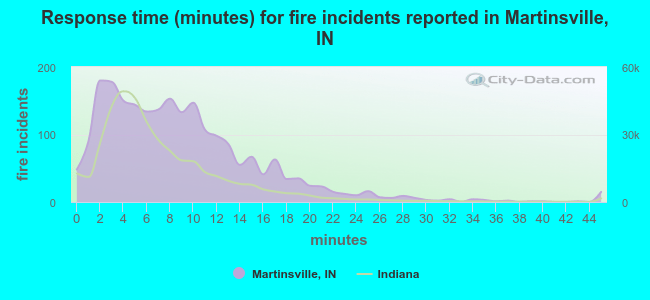 The median response time based on all reported fire incidents is 8 minutes. This is higher than the Indiana median value.
The median response time in Martinsville, IN compared to nearest cities:
(Note: Based on data for all years, including only cities with at least 500 fire incidents)
| Martinsville: | 8 minutes |
| Mooresville: | 6 minutes |
| Bargersville: | 7 minutes |
| Ellettsville: | 6 minutes |
| Nashville: | 12 minutes |
| Bloomington: | 5 minutes |
| Plainfield: | 6 minutes |
| Clayton: | 10 minutes |
| Franklin: | 4 minutes |
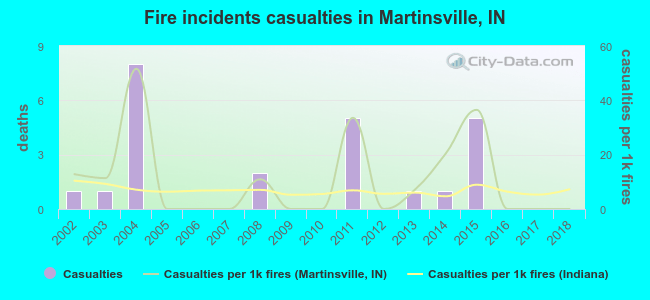 Based on the reports from the years 2002 - 2018 the average number of fire-related casualties per year is 1. The highest number of casualties - 8 took place in 2004, and the lowest - 0 in 2005. The data has a decreasing trend.
The average number of casualties per 1,000 fire incidents is 11. This indicator was the highest - 52 in 2004, and the lowest 0 in 2005. The trend for casualties per 1,000 fire incidents is dropping. Compared to the Indiana value the number of casualties per 1,000 fire incidents is higher.
Based on the reports from the years 2002 - 2018 the average number of fire-related casualties per year is 1. The highest number of casualties - 8 took place in 2004, and the lowest - 0 in 2005. The data has a decreasing trend.
The average number of casualties per 1,000 fire incidents is 11. This indicator was the highest - 52 in 2004, and the lowest 0 in 2005. The trend for casualties per 1,000 fire incidents is dropping. Compared to the Indiana value the number of casualties per 1,000 fire incidents is higher.Casualties per 1,000 incidents in Martinsville, IN compared to nearest cities:
(Note: Based on data for all years, including only cities with at least 500 fire incidents)
| Martinsville: | 10.7 |
| Mooresville: | 11.7 |
| Bargersville: | 7.1 |
| Ellettsville: | 2.0 |
| Nashville: | 4.3 |
| Bloomington: | 4.7 |
| Plainfield: | 33.4 |
| Clayton: | 2.4 |
| Franklin: | 0.8 |
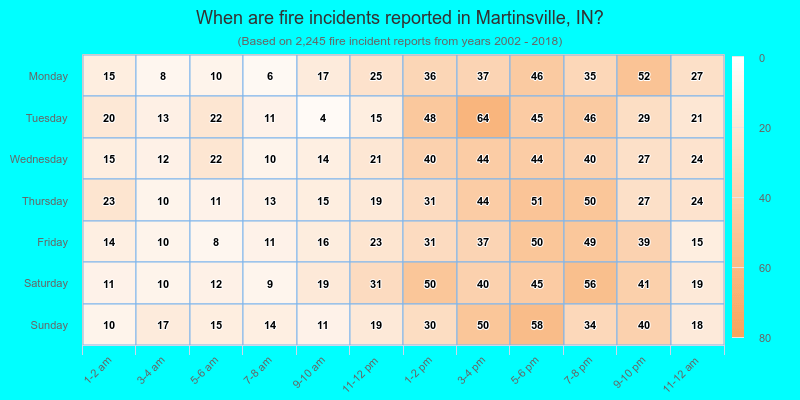
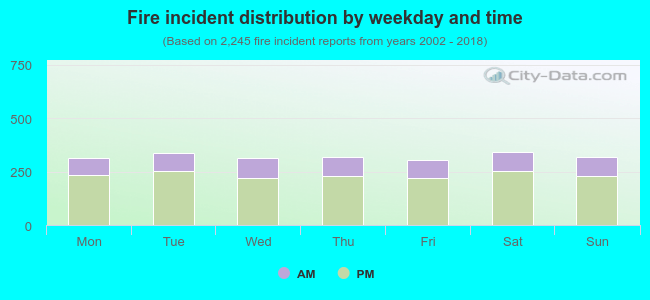 27.2% incidents where reported in the morning and 72.8% in the evening. The most fires (15.3%) took place on Saturday, and the least (13.5%) on Friday.
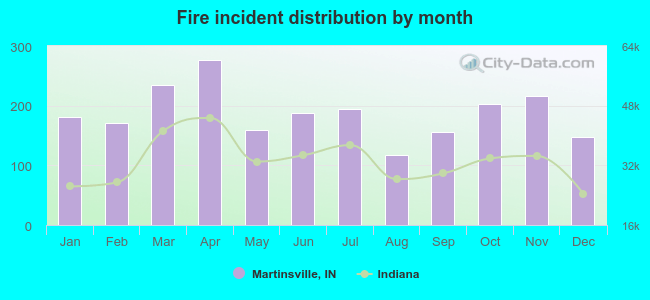 Based on the 2,245 fire incidents from years 2002 - 2018 most fires (12.3%) took place during April, and the least (5.3%) in August.
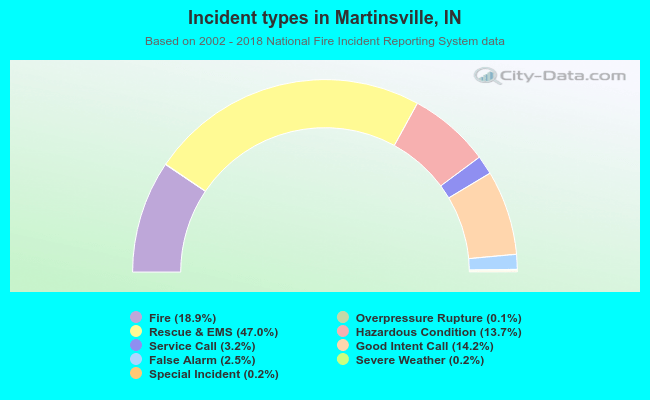 Out of all 11,887 cases reported during the years 2002 - 2018, the most belonged to the categories: Rescue & EMS (47.0%), Fire (18.9%), and Good Intent Call (14.2%).
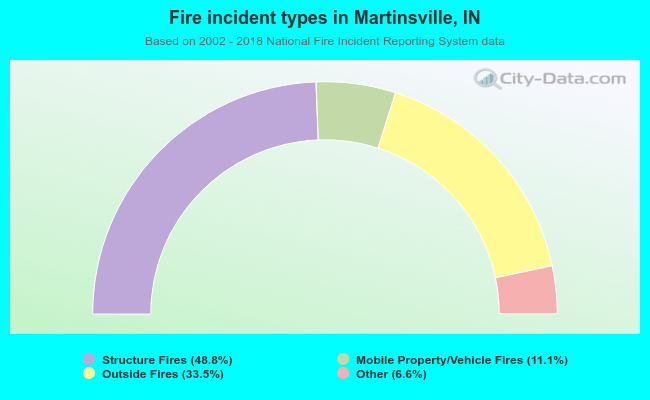 When looking into fire subcategories, the most incidents belonged to: Structure Fires (48.8%), and Outside Fires (33.5%).