Chester: Fire Incidents, New York (NY)
Where are fire incidents reported in Chester, NY
Something went wrong! Please refresh the page.
| Fire incidents reported | |
|---|---|
| Sreet name | Count |
| ROUTE 17 | 134 |
| BROOKSIDE AVE | 130 |
| WHISPERING HILLS | 116 |
| CRAIGVILLE RD | 66 |
| PINE HILL RD | 56 |
| WHISPERING HILLS DR | 54 |
| LAROE RD | 50 |
| KINGS HWY | 48 |
| MAIN ST | 46 |
| ROUTE 94 | 40 |
| CONKLINGTOWN RD | 38 |
| ROUTE 17M | 38 |
| HIGH ST | 34 |
| BELLVALE RD | 32 |
| HAMBLETONIAN AVE | 30 |
| GLENMERE RD | 28 |
| GREYCOURT RD | 26 |
| JOHNSON RD | 26 |
| LEONE LANE | 24 |
| BULL MILL RD | 22 |
| MEADOW AVE | 22 |
| SURREY RD | 22 |
| BLACK MEADOW RD | 20 |
| GREEN MEADOWS WAY | 20 |
| AYR RD | 18 |
| ELIZABETH DR | 18 |
| MAIN STREET | 18 |
| CONKLINTOWN RD | 16 |
| LAGUARDIA WAY | 16 |
| SUGAR LOAF MTN RD | 16 |
2002 - 2018 National Fire Incident Reporting System (NFIRS) incidents
- Incident types reported to NFIRS in Chester, NY
- 1,87838.8%Hazardous Condition
- 1,15824.0%Fire
- 62212.9%Service Call
- 62112.8%False Alarm
- 4709.7%Good Intent Call
- 751.6%Rescue & EMS
- 50.1%Overpressure Rupture
- 50.1%Severe Weather
- Fire incident types reported to NFIRS in Chester, NY
- 66557.4%Structure Fires
- 32428.0%Outside Fires
- 15713.6%Mobile Property/Vehicle Fires
- 121.0%Other
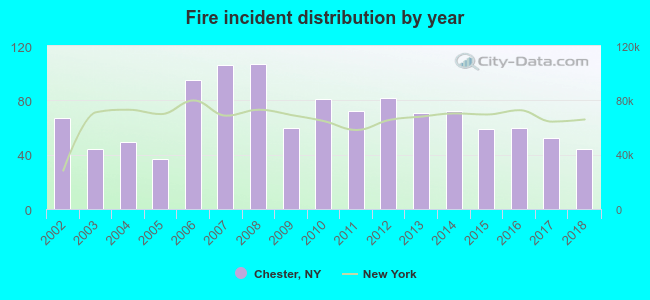 Based on the data from the years 2002 - 2018 the average number of fire incidents per year is 68. The highest number of reported fires - 107 took place in 2008, and the least - 37 in 2005. The data has a declining trend.
 The median response time based on all reported fire incidents is 6 minutes. This is higher compared to the New York median value.
The median response time in Chester, NY compared to nearest cities:
(Note: Based on data for all years, including only cities with at least 500 fire incidents)
| Chester: | 6 minutes |
| Goshen: | 4 minutes |
| Monroe: | 2 minutes |
| Warwick: | 4 minutes |
| Middletown: | 3 minutes |
| Montgomery: | 6 minutes |
| Walden: | 5 minutes |
| New Windsor: | 7 minutes |
| Pomona: | 5 minutes |
 Based on the reports from the years 2002 - 2018 the average number of fire-related yearly casualties is 0. The highest number of casualties - 2 took place in 2011, and the lowest - 0 in 2003. The data has a decreasing trend.
The average number of injuries per 1,000 fire incidents is 4. This indicator was the highest - 28 in 2011, and the lowest 0 in 2003. The trend for casualties per 1,000 fires is decreasing. Compared to the state value the number of injuries per 1,000 fire incidents is much lower.
Based on the reports from the years 2002 - 2018 the average number of fire-related yearly casualties is 0. The highest number of casualties - 2 took place in 2011, and the lowest - 0 in 2003. The data has a decreasing trend.
The average number of injuries per 1,000 fire incidents is 4. This indicator was the highest - 28 in 2011, and the lowest 0 in 2003. The trend for casualties per 1,000 fires is decreasing. Compared to the state value the number of injuries per 1,000 fire incidents is much lower.Casualties per 1,000 incidents in Chester, NY compared to nearest cities:
(Note: Based on data for all years, including only cities with at least 500 fire incidents)
| Chester: | 3.5 |
| Goshen: | 0.0 |
| Monroe: | 7.2 |
| Warwick: | 0.0 |
| Middletown: | 8.6 |
| Montgomery: | 0.0 |
| Walden: | 6.4 |
| New Windsor: | 9.9 |
| Pomona: | 3.8 |
 32.0% incidents where reported in the morning and 68.0% in the evening. The most fires (16.0%) took place on Friday, and the least (12.9%) on Monday.
 According to the 1,158 incident reports from years 2002 - 2018 most fires (11.7%) took place during April, and the least (5.8%) in September.
 Out of all 4,834 cases reported during the years 2002 - 2018, the most belonged to the categories: Hazardous Condition (38.8%), Fire (24.0%), and Service Call (12.9%).
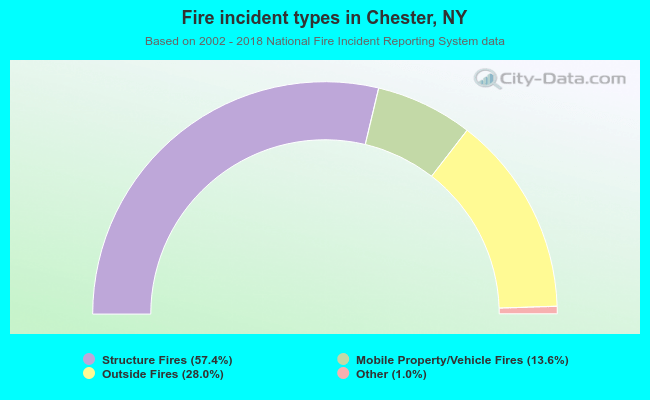 When looking into fire subcategories, the most reports belonged to: Structure Fires (57.4%), and Outside Fires (28.0%).