Warwick: Fire Incidents, New York (NY)
Where are fire incidents reported in Warwick, NY
Something went wrong! Please refresh the page.
|
| |||||||||||||||||||||||||||||||||||||||||||||||||||||||||||||||||||||||||||||||||||||||||||||||||||||||||||||
| Other | 230 | |||||||||||||||||||||||||||||||||||||||||||||||||||||||||||||||||||||||||||||||||||||||||||||||||||||||||||||
2004 - 2018 National Fire Incident Reporting System (NFIRS) incidents
- Incident types reported to NFIRS in Warwick, NY
- 1,63141.1%Hazardous Condition
- 77819.6%Fire
- 68917.4%False Alarm
- 3619.1%Service Call
- 2676.7%Rescue & EMS
- 2365.9%Good Intent Call
- 40.1%Overpressure Rupture
- Fire incident types reported to NFIRS in Warwick, NY
- 39350.5%Structure Fires
- 28036.0%Outside Fires
- 8611.1%Mobile Property/Vehicle Fires
- 192.4%Other
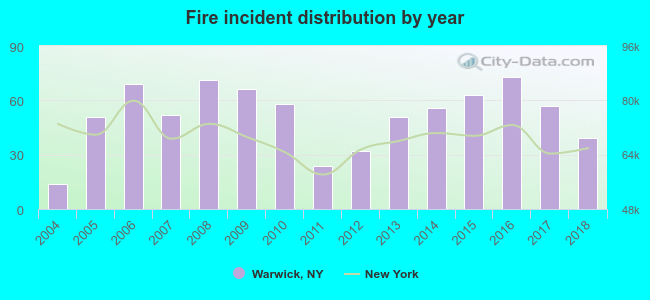 According to the data from the years 2004 - 2018 the average number of fire incidents per year is 52. The highest number of fires - 73 took place in 2016, and the least - 14 in 2004. The data has an increasing trend.
The average number of yearly fire incidents per 10k residents in Warwick, NY compared to nearest cities:
(Note: Based on data for the last 3 years, including only cities with population 5,000 and above)
| Warwick: | 83.0 |
| Monroe: | 267.1 |
| Goshen: | 65.6 |
| Kiryas Joel: | 1.2 |
| Blooming Grove: | 4.8 |
| Middletown: | 60.0 |
| Suffern: | 30.6 |
| Wesley Hills: | 31.0 |
| Washingtonville: | 29.9 |
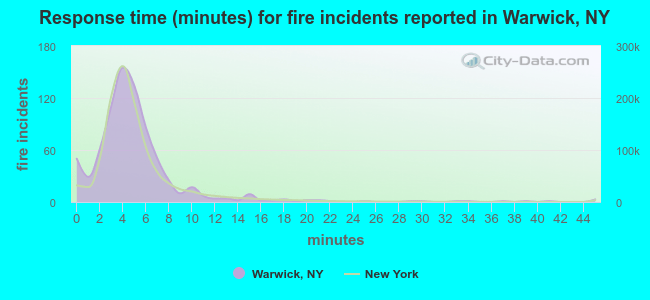 The median response time based on all reported fire incidents is 4 minutes. This is close to the New York median value.
The median response time in Warwick, NY compared to nearest cities:
(Note: Based on data for all years, including only cities with at least 500 fire incidents)
| Warwick: | 4 minutes |
| Chester: | 6 minutes |
| West Milford: | 6 minutes |
| Monroe: | 2 minutes |
| Goshen: | 4 minutes |
| Ringwood: | 3 minutes |
| Middletown: | 3 minutes |
| Suffern: | 3 minutes |
| Pomona: | 5 minutes |
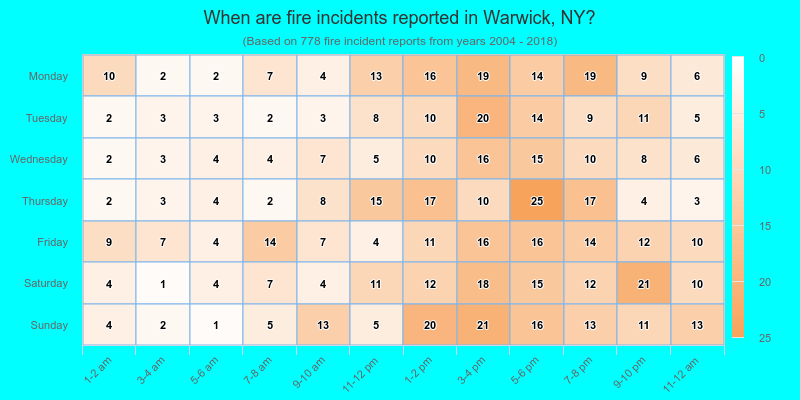
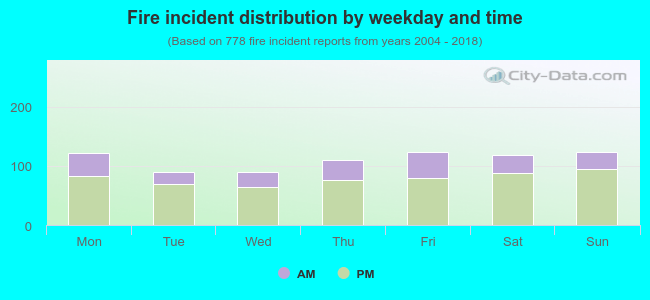 28.8% incidents where reported in the morning and 71.2% in the evening. The most fires (15.9%) took place on Friday, and the least (11.6%) on Tuesday.
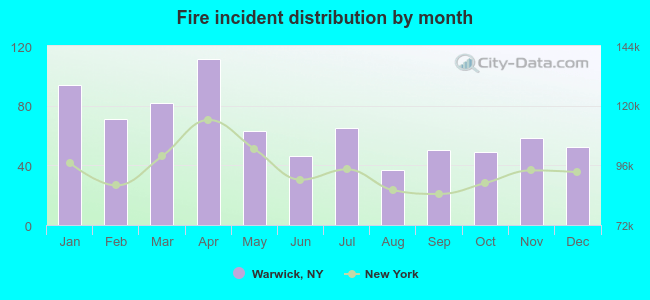 Based on the 778 incident reports from years 2004 - 2018 most fires (14.3%) took place during April, and the least (4.8%) in August.
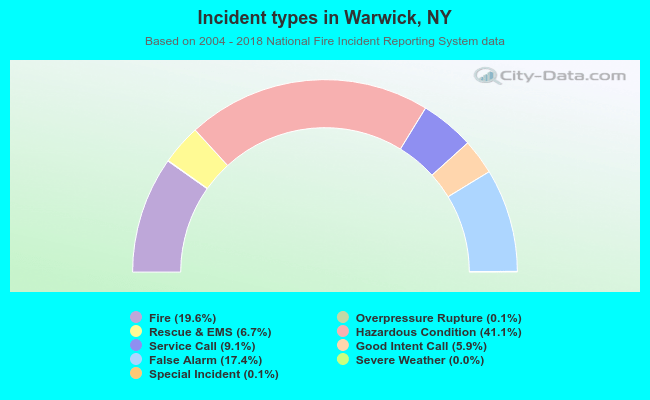 Out of all 3,969 cases reported during the years 2004 - 2018, the most belonged to the categories: Hazardous Condition (41.1%), Fire (19.6%), and False Alarm (17.4%).
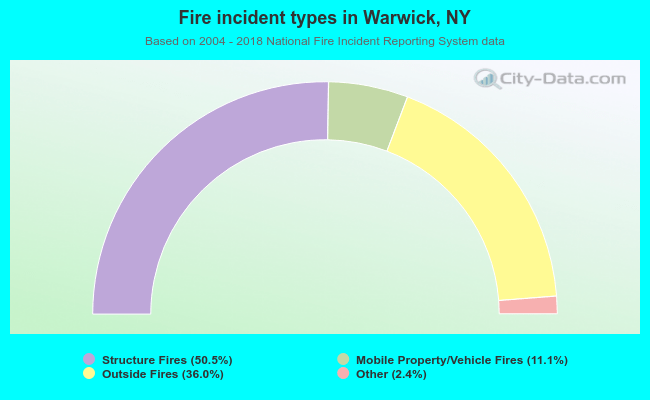 When looking into fire subcategories, the most incidents belonged to: Structure Fires (50.5%), and Outside Fires (36.0%).