Middletown: Fire Incidents, New York (NY)
Where are fire incidents reported in Middletown, NY
Something went wrong! Please refresh the page.
| Fire incidents reported | |
|---|---|
| Sreet name | Count |
| ROUTE 211 EAST | 292 |
| DOLSON AVENUE | 132 |
| ROUTE 211 EAST | 120 |
| NORTH STREET | 114 |
| EAST MAIN STREET | 110 |
| GALLERIA DR | 92 |
| WEST MAIN STREET | 86 |
| SENIORWAY | 80 |
| WICKHAM AVENUE | 70 |
| MAIN ST | 68 |
| ROUTE 211 WST | 60 |
| MONHAGEN AVENUE | 58 |
| 211 | 56 |
| GALLERIA DRIVE | 56 |
| HIGHLAND AVENUE | 56 |
| LINDEN AVENUE | 50 |
| GENUNG STREET | 48 |
| TALL OAKS APARTMENTS | 48 |
| CRYSTAL RUN RD | 44 |
| COTTAGE STREET | 42 |
| NORTH CHURCH STREET | 42 |
| 84 ROUTE-INTERSTATE | 38 |
| SPROAT STREET | 38 |
| ACADEMY AVE. | 36 |
| BERKMAN DR | 36 |
| GRAND AVENUE | 36 |
| INTERSTATE 84 | 36 |
| LAKE AVENUE | 34 |
| NYS 17M RT | 34 |
| STRATFORD LN | 34 |
| Other | 1,335 |
2002 - 2018 National Fire Incident Reporting System (NFIRS) incidents
- Incident types reported to NFIRS in Middletown, NY
- 6,25627.2%Hazardous Condition
- 4,91221.4%False Alarm
- 3,92817.1%Rescue & EMS
- 3,38114.7%Fire
- 2,89412.6%Service Call
- 1,5376.7%Good Intent Call
- 410.2%Severe Weather
- 300.1%Special Incident
- 280.1%Overpressure Rupture
- Fire incident types reported to NFIRS in Middletown, NY
- 1,39741.3%Structure Fires
- 1,08332.0%Outside Fires
- 51715.3%Mobile Property/Vehicle Fires
- 38411.4%Other
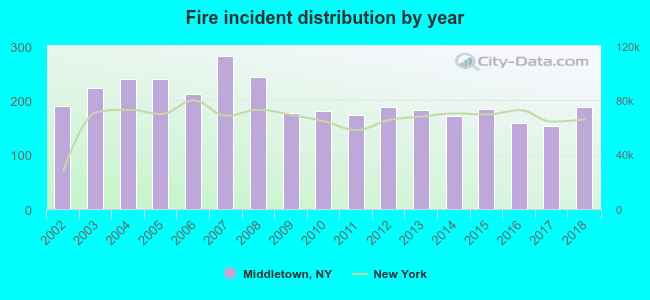 Based on the data from the years 2002 - 2018 the average number of fires per year is 199. The highest number of reported fires - 281 took place in 2007, and the least - 153 in 2017. The data has a declining trend.
The average number of yearly fire incidents per 10k residents in Middletown, NY compared to nearest cities:
(Note: Based on data for the last 3 years, including only cities with population 5,000 and above)
| Middletown: | 60.0 |
| Mount Hope: | 12.8 |
| Goshen: | 65.6 |
| Deerpark: | 1.3 |
| Blooming Grove: | 4.8 |
| Warwick: | 83.0 |
| Washingtonville: | 29.9 |
| Walden: | 23.8 |
| Port Jervis: | 37.8 |
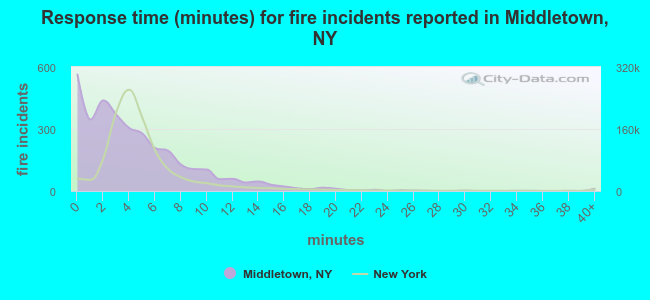 The median response time based on all reported fire incidents is 3 minutes. This is lower compared to the state median value.
The median response time in Middletown, NY compared to nearest cities:
(Note: Based on data for all years, including only cities with at least 500 fire incidents)
| Middletown: | 3 minutes |
| Goshen: | 4 minutes |
| Chester: | 6 minutes |
| Montgomery: | 6 minutes |
| Pine Bush: | 6 minutes |
| Warwick: | 4 minutes |
| Walden: | 5 minutes |
| Monroe: | 2 minutes |
| Ellenville: | 6 minutes |
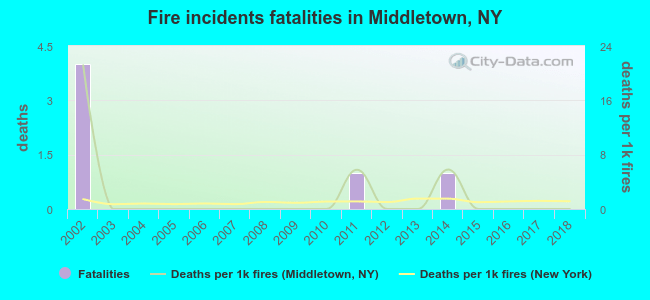 Based on the data from the years 2002 - 2018 the average number of fire-related fatalities per year is 0. The highest number of reported deaths - 4 took place in 2002, and the lowest - 0 in 2003. The data has a declining trend.
The average number of fatalities per 1,000 fire incidents is 2. This indicator was the highest - 21 in 2002, and the lowest 0 in 2003. The trend for fatalities per 1,000 fires is decreasing. Compared to the New York value the number of fatalities per 1,000 fire incidents is higher.
Based on the data from the years 2002 - 2018 the average number of fire-related fatalities per year is 0. The highest number of reported deaths - 4 took place in 2002, and the lowest - 0 in 2003. The data has a declining trend.
The average number of fatalities per 1,000 fire incidents is 2. This indicator was the highest - 21 in 2002, and the lowest 0 in 2003. The trend for fatalities per 1,000 fires is decreasing. Compared to the New York value the number of fatalities per 1,000 fire incidents is higher.
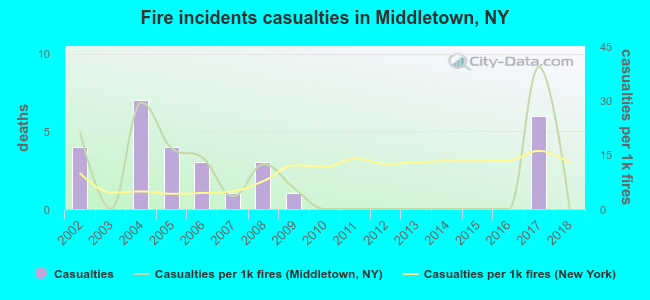 According to the data from the years 2002 - 2018 the average number of fire-related casualties per year is 2. The highest number of reported casualties - 7 took place in 2004, and the lowest - 0 in 2003. The data has a declining trend.
The average number of injuries per 1,000 fires is 8. This indicator was the highest - 39 in 2017, and the lowest 0 in 2003. The trend for casualties per 1,000 fire incidents is dropping. Compared to the New York value the number of injuries per 1,000 fire incidents is about the same.
According to the data from the years 2002 - 2018 the average number of fire-related casualties per year is 2. The highest number of reported casualties - 7 took place in 2004, and the lowest - 0 in 2003. The data has a declining trend.
The average number of injuries per 1,000 fires is 8. This indicator was the highest - 39 in 2017, and the lowest 0 in 2003. The trend for casualties per 1,000 fire incidents is dropping. Compared to the New York value the number of injuries per 1,000 fire incidents is about the same.Casualties per 1,000 incidents in Middletown, NY compared to nearest cities:
(Note: Based on data for all years, including only cities with at least 500 fire incidents)
| Middletown: | 8.6 |
| Goshen: | 0.0 |
| Chester: | 3.5 |
| Montgomery: | 0.0 |
| Pine Bush: | 0.0 |
| Warwick: | 0.0 |
| Walden: | 6.4 |
| Monroe: | 7.2 |
| Ellenville: | 0.0 |
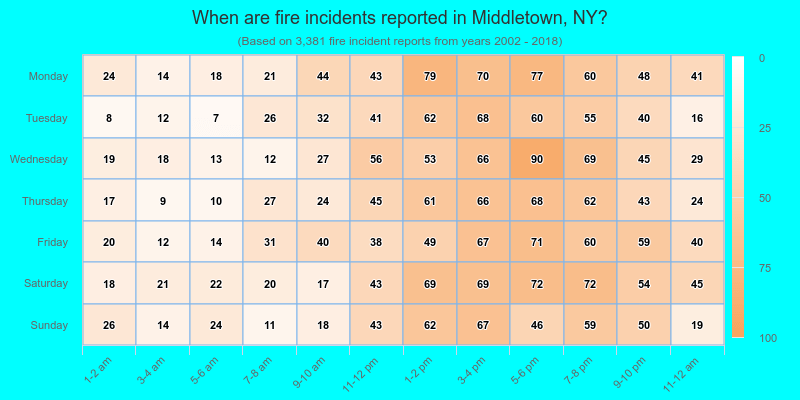
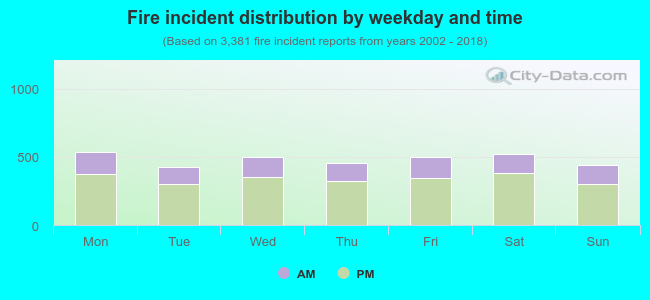 29.5% incidents where reported in the morning and 70.5% in the evening. The most fires (15.9%) took place on Monday, and the least (12.6%) on Tuesday.
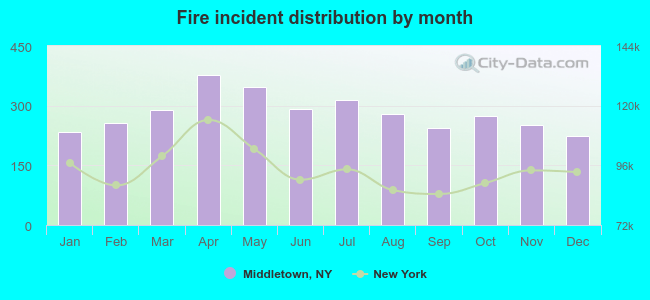 According to the 3,381 fires from years 2002 - 2018 most fires (11.2%) took place during April, and the least (6.6%) in December.
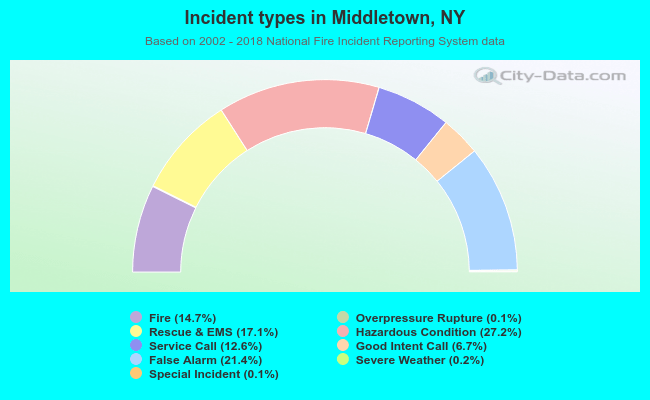 Out of all 23,007 cases reported during the years 2002 - 2018, the most belonged to the categories: Hazardous Condition (27.2%), False Alarm (21.4%), and Rescue & EMS (17.1%).
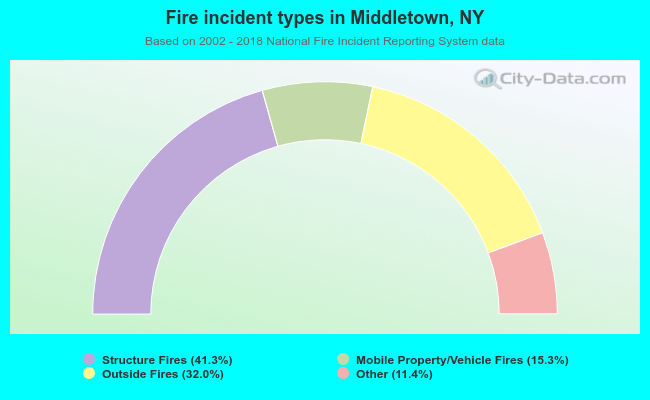 When looking into fire subcategories, the most incidents belonged to: Structure Fires (41.3%), and Outside Fires (32.0%).