South Milwaukee: Fire Incidents, Wisconsin (WI)
Where are fire incidents reported in South Milwaukee, WI
Something went wrong! Please refresh the page.
| Fire incidents reported | |
|---|---|
| Sreet name | Count |
| CHICAGO AVE | 164 |
| MILWAUKEE AVE | 98 |
| SOUTHTOWNE DR | 74 |
| MARQUETTE AVE | 66 |
| RAWSON AVE | 62 |
| 15TH AVE | 58 |
| MADISON AVE | 54 |
| 5TH AVE | 50 |
| MICHIGAN AVE | 46 |
| 10TH AVE | 44 |
| MARION AVE | 44 |
| HAWTHORNE AVE | 42 |
| 9TH AVE | 38 |
| MINNESOTA AVE | 36 |
| MONROE AVE | 34 |
| NICHOLSON AVE | 34 |
| GRANT PARK AREA | 32 |
| LAKE DR | 30 |
| MARSHALL AVE | 28 |
| MENOMONEE AVE | 28 |
| BLAKE AVE | 26 |
| DREXEL BLVD | 26 |
| MISSOURI AVE | 26 |
| COLUMBIA AVE | 24 |
| LAKEVIEW AVE | 24 |
| MANISTIQUE AVE | 24 |
| ELM AVE | 22 |
| MANITOBA AVE | 22 |
| RAWSON WOODS | 22 |
| 6TH AVE | 20 |
2002 - 2018 National Fire Incident Reporting System (NFIRS) incidents
- Incident types reported to NFIRS in South Milwaukee, WI
- 9,84972.0%Rescue & EMS
- 1,2399.1%Hazardous Condition
- 9767.1%Fire
- 8916.5%Service Call
- 4723.5%False Alarm
- 2081.5%Good Intent Call
- 260.2%Special Incident
- Fire incident types reported to NFIRS in South Milwaukee, WI
- 51452.7%Structure Fires
- 35336.2%Outside Fires
- 818.3%Mobile Property/Vehicle Fires
- 282.9%Other
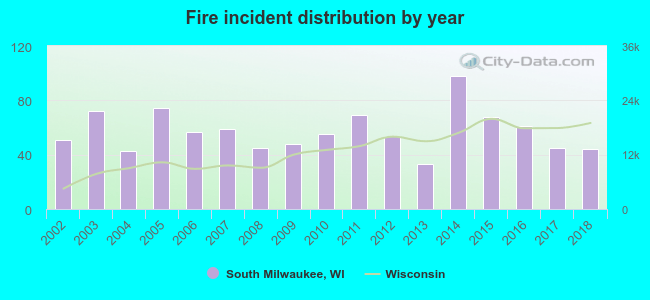 According to the data from the years 2002 - 2018 the average number of fires per year is 57. The highest number of reported fire incidents - 98 took place in 2014, and the least - 33 in 2013. The data has a declining trend.
The average number of yearly fire incidents per 10k residents in South Milwaukee, WI compared to nearest cities:
(Note: Based on data for the last 3 years, including only cities with population 5,000 and above)
| South Milwaukee: | 23.5 |
| Oak Creek: | 30.0 |
| Cudahy: | 31.1 |
| Greendale: | 17.0 |
| Franklin: | 22.7 |
| Greenfield: | 14.3 |
| Caledonia: | 8.1 |
| Hales Corners: | 25.4 |
| West Allis: | 18.9 |
 The median response time based on all reported fire incidents is 3 minutes. This is much lower than the Wisconsin median value.
The median response time in South Milwaukee, WI compared to nearest cities:
(Note: Based on data for all years, including only cities with at least 500 fire incidents)
| South Milwaukee: | 3 minutes |
| Oak Creek: | 6 minutes |
| Cudahy: | 3 minutes |
| Franklin: | 6 minutes |
| Greenfield: | 6 minutes |
| West Allis: | 4 minutes |
| Milwaukee: | 4 minutes |
| Wauwatosa: | 6 minutes |
| Racine: | 5 minutes |
 Based on the reports from the years 2002 - 2018 the average number of fire-related yearly casualties is 1. The highest number of casualties - 3 took place in 2007, and the lowest - 0 in 2002. The data has a constant trend.
The average number of casualties per 1,000 fire incidents is 18. This indicator was the highest - 51 in 2007, and the lowest 0 in 2002. The trend for injuries per 1,000 fire incidents is increasing. Compared to the state value the number of casualties per 1,000 fires is higher.
Based on the reports from the years 2002 - 2018 the average number of fire-related yearly casualties is 1. The highest number of casualties - 3 took place in 2007, and the lowest - 0 in 2002. The data has a constant trend.
The average number of casualties per 1,000 fire incidents is 18. This indicator was the highest - 51 in 2007, and the lowest 0 in 2002. The trend for injuries per 1,000 fire incidents is increasing. Compared to the state value the number of casualties per 1,000 fires is higher.Casualties per 1,000 incidents in South Milwaukee, WI compared to nearest cities:
(Note: Based on data for all years, including only cities with at least 500 fire incidents)
| South Milwaukee: | 18.4 |
| Oak Creek: | 15.1 |
| Cudahy: | 8.5 |
| Franklin: | 11.6 |
| Greenfield: | 4.0 |
| West Allis: | 53.5 |
| Milwaukee: | 1.6 |
| Wauwatosa: | 28.7 |
| Racine: | 13.2 |
 29.2% incidents where reported in the morning and 70.8% in the evening. The most fires (16.6%) took place on Saturday, and the least (12.1%) on Thursday.
 Based on the 976 fire incidents from years 2002 - 2018 most fires (10.9%) took place during May, and the least (5.0%) in December.
 Out of all 13,677 cases reported during the years 2002 - 2018, the most belonged to the categories: Rescue & EMS (72.0%), Hazardous Condition (9.1%), and Fire (7.1%).
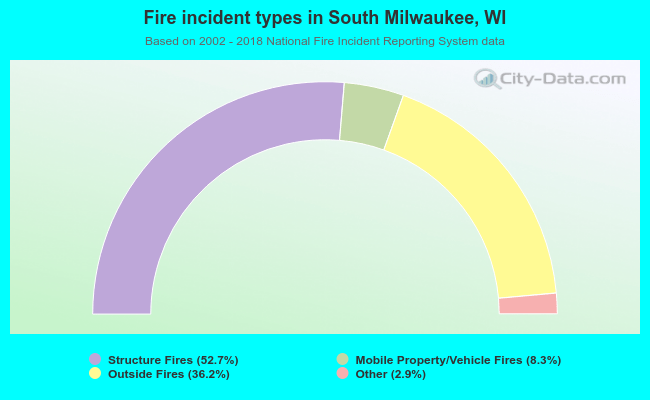 When looking into fire subcategories, the most incidents belonged to: Structure Fires (52.7%), and Outside Fires (36.2%).