East Grand Rapids: Fire Incidents, Michigan (MI)
Where are fire incidents reported in East Grand Rapids, MI
Something went wrong! Please refresh the page.
|
| |||||||||||||||||||||||||||||||||||||||||||||||||||||||||||||||||||||||||||||||||||||||||||||||||||||||||||||
2002 - 2018 National Fire Incident Reporting System (NFIRS) incidents
- Incident types reported to NFIRS in East Grand Rapids, MI
- 1,15351.2%Rescue & EMS
- 52123.1%Hazardous Condition
- 32514.4%False Alarm
- 1315.8%Fire
- 924.1%Good Intent Call
- 271.2%Service Call
- Fire incident types reported to NFIRS in East Grand Rapids, MI
- 6549.6%Structure Fires
- 2519.1%Other
- 2418.3%Mobile Property/Vehicle Fires
- 1713.0%Outside Fires
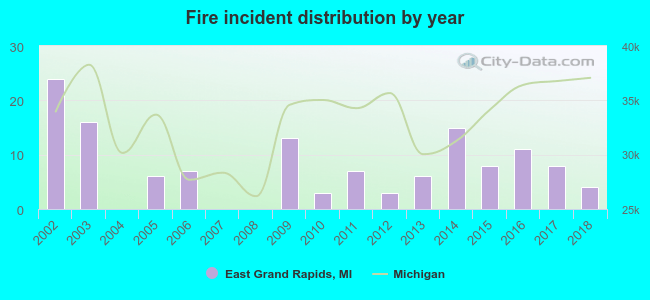 Based on the data from the years 2002 - 2018 the average number of fires per year is 8. The highest number of fires - 24 took place in 2002, and the least - 0 in 2004. The data has a decreasing trend.
The average number of yearly fire incidents per 10k residents in East Grand Rapids, MI compared to nearest cities:
(Note: Based on data for the last 3 years, including only cities with population 5,000 and above)
| East Grand Rapids: | 6.8 |
| Grand Rapids: | 42.6 |
| Kentwood: | 22.3 |
| Wyoming: | 27.7 |
| Comstock Park: | 62.8 |
| Walker: | 31.9 |
| Cutlerville: | 4.9 |
| Grandville: | 32.4 |
| Byron Center: | 108.8 |
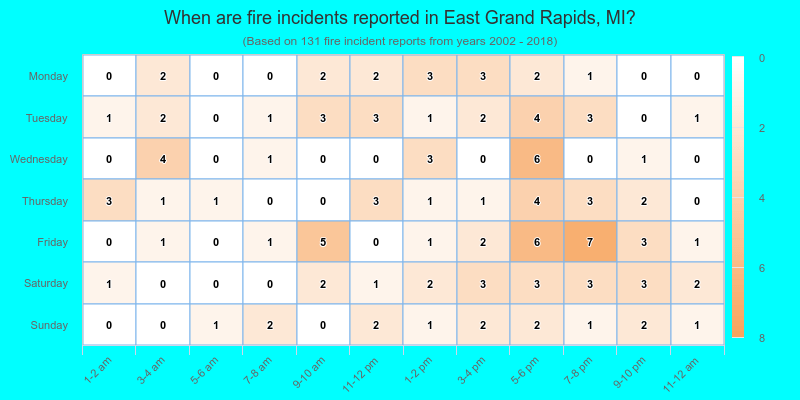
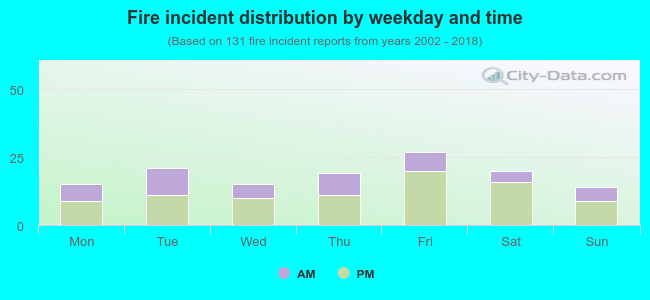 34.4% incidents where reported in the morning and 65.6% in the evening. The most fires (20.6%) took place on Friday, and the least (10.7%) on Sunday.
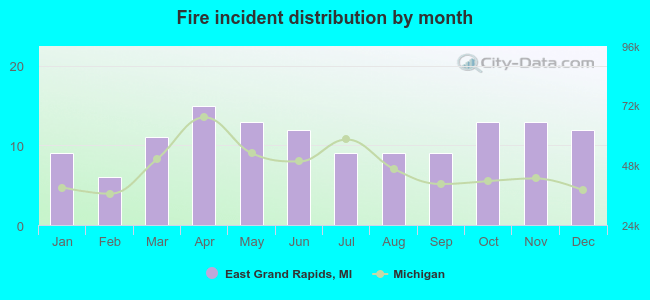 Based on the 131 fire incidents from years 2002 - 2018 most fires (11.5%) took place during April, and the least (4.6%) in February.
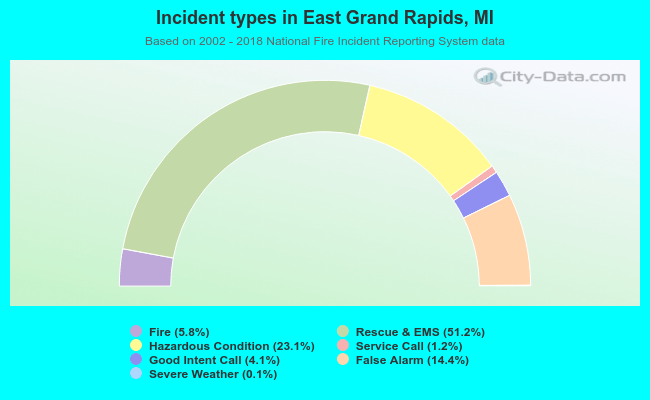 Out of all 2,251 cases reported during the years 2002 - 2018, the most belonged to the categories: Overpressure Rupture (51.2%), Rescue & EMS (23.1%), and Good Intent Call (14.4%).
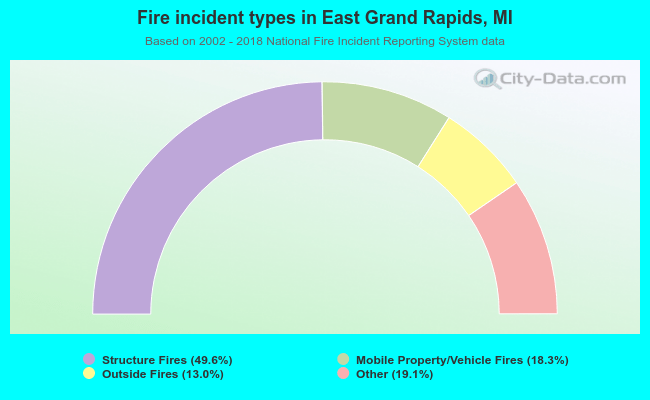 When looking into fire subcategories, the most incidents belonged to: Structure Fires (49.6%), and Other (19.1%).