Hershey: Fire Incidents, Pennsylvania (PA)
Where are fire incidents reported in Hershey, PA
Something went wrong! Please refresh the page.
| Fire incidents reported | |
|---|---|
| Sreet name | Count |
| CHOCOLATE AVE | 280 |
| UNIVERSITY DR | 142 |
| HERSHEYPARK DR | 96 |
| GOVERNOR RD | 66 |
| DERRY RD | 64 |
| SAND HILL RD | 50 |
| OUT OF DISTRICT (DAUPHIN) | 44 |
| SANDHILL RD | 40 |
| CARACAS AVE | 38 |
| MAIN ST | 38 |
| BRIARCREST DR | 34 |
| CLEARWATER RD | 34 |
| COCOA AVE | 28 |
| GRANADA AVE | 28 |
| HERSHEY RD | 28 |
| LINGLE AVE | 28 |
| REESE AVE | 28 |
| BACHMANVILLE RD | 26 |
| CHURCH RD | 26 |
| AREBA AVE | 24 |
| TOWNHOUSE | 22 |
| BROOK DR | 20 |
| BULLFROG VALLEY RD | 20 |
| DAUPHIN COUNTY | 20 |
| FISHBURN RD | 20 |
| HOCKERSVILLE RD | 20 |
| CANAL ST | 18 |
| ELIZABETHTOWN RD | 18 |
| LUCY AVE | 18 |
| PARK BLVD | 18 |
2005 - 2018 National Fire Incident Reporting System (NFIRS) incidents
- Incident types reported to NFIRS in Hershey, PA
- 1,28545.6%Fire
- 69524.6%Hazardous Condition
- 37713.4%Good Intent Call
- 2017.1%False Alarm
- 1254.4%Service Call
- 1154.1%Rescue & EMS
- 180.6%Severe Weather
- 40.1%Overpressure Rupture
- Fire incident types reported to NFIRS in Hershey, PA
- 90670.5%Structure Fires
- 25319.7%Outside Fires
- 957.4%Mobile Property/Vehicle Fires
- 312.4%Other
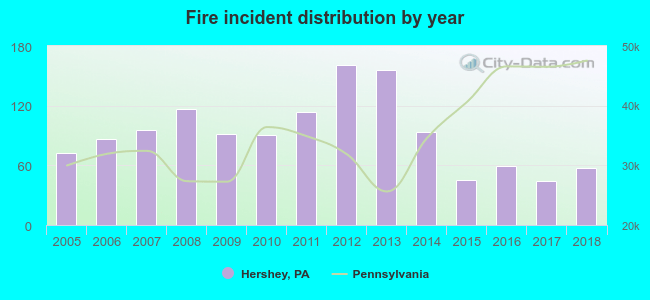 Based on the data from the years 2005 - 2018 the average number of fires per year is 92. The highest number of fires - 161 took place in 2012, and the least - 44 in 2017. The data has a decreasing trend.
The average number of yearly fire incidents per 10k residents in Hershey, PA compared to nearest cities:
(Note: Based on data for the last 3 years, including only cities with population 5,000 and above)
| Hershey: | 37.4 |
| Palmyra: | 69.9 |
| Middletown: | 69.5 |
| Elizabethtown: | 78.4 |
| Steelton: | 64.1 |
| Harrisburg: | 188.7 |
| New Cumberland: | 60.1 |
| Lebanon: | 78.3 |
| Mount Joy: | 82.4 |
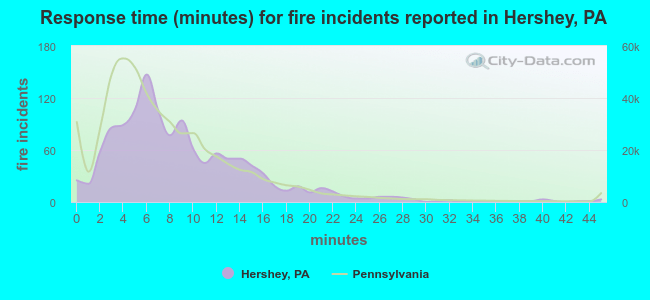 The median response time based on all reported fire incidents is 8 minutes. This is higher compared to the Pennsylvania median value.
The median response time in Hershey, PA compared to nearest cities:
(Note: Based on data for all years, including only cities with at least 500 fire incidents)
| Hershey: | 8 minutes |
| Hummelstown: | 10 minutes |
| Palmyra: | 9 minutes |
| Middletown: | 9 minutes |
| Annville: | 8 minutes |
| Elizabethtown: | 9 minutes |
| Steelton: | 7 minutes |
| Harrisburg: | 6 minutes |
| New Cumberland: | 9 minutes |
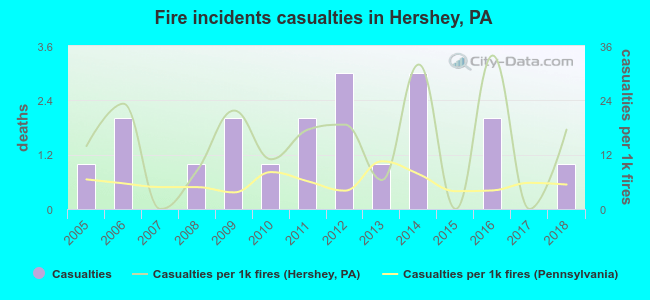 According to the reports from the years 2005 - 2018 the average number of fire-related yearly casualties is 1. The highest number of casualties - 3 took place in 2012, and the lowest - 0 in 2007. The data has a constant trend.
The average number of casualties per 1,000 fire incidents is 15. This indicator was the highest - 34 in 2016, and the lowest 0 in 2007. The trend for casualties per 1,000 fires is rising. Compared to the state value the number of injuries per 1,000 incidents is much higher.
According to the reports from the years 2005 - 2018 the average number of fire-related yearly casualties is 1. The highest number of casualties - 3 took place in 2012, and the lowest - 0 in 2007. The data has a constant trend.
The average number of casualties per 1,000 fire incidents is 15. This indicator was the highest - 34 in 2016, and the lowest 0 in 2007. The trend for casualties per 1,000 fires is rising. Compared to the state value the number of injuries per 1,000 incidents is much higher.Casualties per 1,000 incidents in Hershey, PA compared to nearest cities:
(Note: Based on data for all years, including only cities with at least 500 fire incidents)
| Hershey: | 14.8 |
| Hummelstown: | 7.1 |
| Palmyra: | 7.3 |
| Middletown: | 0.0 |
| Annville: | 3.3 |
| Elizabethtown: | 3.1 |
| Steelton: | 4.5 |
| Harrisburg: | 6.2 |
| New Cumberland: | 1.3 |
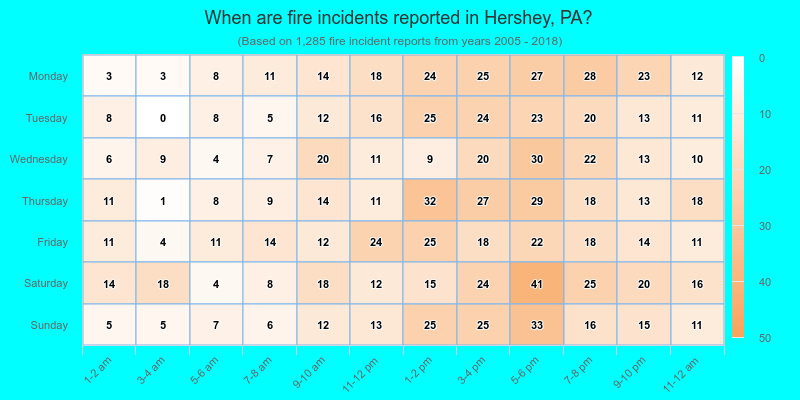
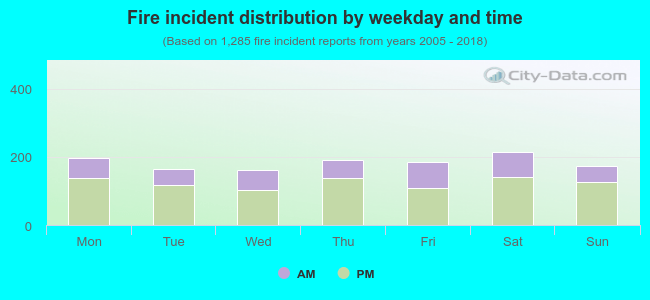 32.3% incidents where reported in the morning and 67.7% in the evening. The most fires (16.7%) took place on Saturday, and the least (12.5%) on Wednesday.
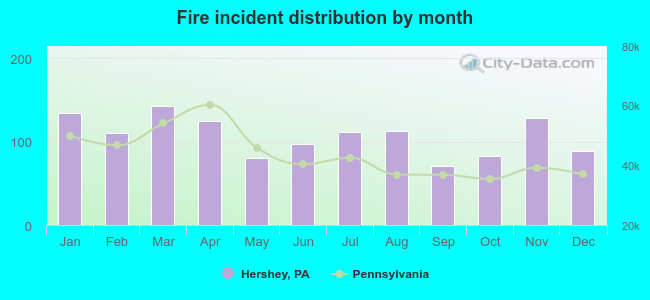 According to the 1,285 fires from years 2005 - 2018 most fires (11.1%) took place during March, and the least (5.5%) in September.
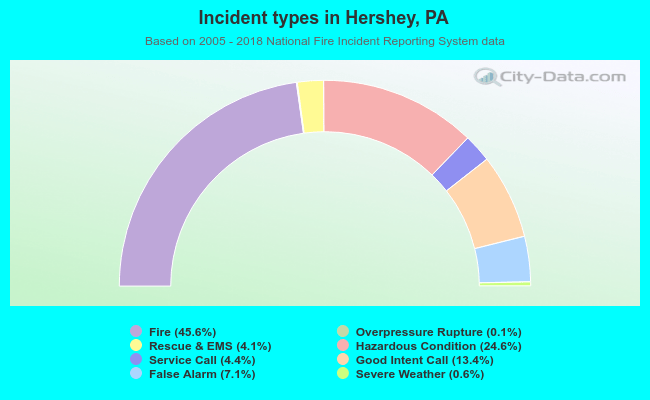 Out of all 2,820 cases reported during the years 2005 - 2018, the most belonged to the categories: Fire (45.6%), Hazardous Condition (24.6%), and Good Intent Call (13.4%).
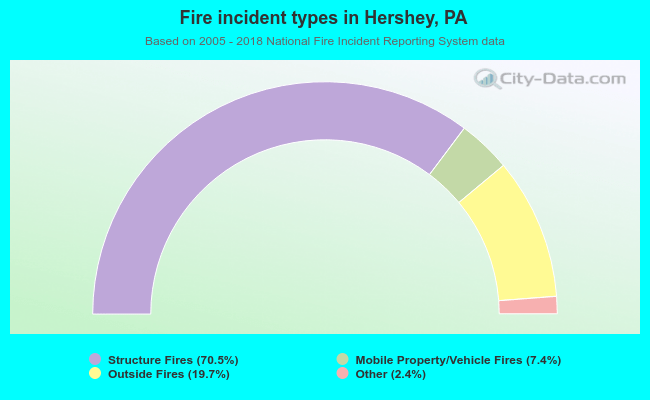 When looking into fire subcategories, the most incidents belonged to: Structure Fires (70.5%), and Outside Fires (19.7%).