Middletown: Fire Incidents, Pennsylvania (PA)
Where are fire incidents reported in Middletown, PA
Something went wrong! Please refresh the page.
|
| |||||||||||||||||||||||||||||||||||||||||||||||||||||||||||||||||||||||||||||||||||||||||||||||||||||||||||||
2003 - 2018 National Fire Incident Reporting System (NFIRS) incidents
- Incident types reported to NFIRS in Middletown, PA
- 1,71236.6%Hazardous Condition
- 1,39629.9%Fire
- 64313.8%Good Intent Call
- 3297.0%False Alarm
- 3287.0%Rescue & EMS
- 2254.8%Service Call
- 370.8%Special Incident
- Fire incident types reported to NFIRS in Middletown, PA
- 93667.0%Structure Fires
- 21215.2%Mobile Property/Vehicle Fires
- 18913.5%Outside Fires
- 594.2%Other
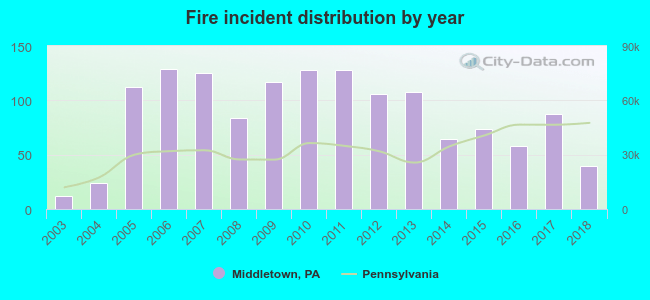 Based on the data from the years 2003 - 2018 the average number of fires per year is 87. The highest number of fire incidents - 129 took place in 2006, and the least - 12 in 2003. The data has an increasing trend.
The average number of yearly fire incidents per 10k residents in Middletown, PA compared to nearest cities:
(Note: Based on data for the last 3 years, including only cities with population 5,000 and above)
| Middletown: | 69.5 |
| Steelton: | 64.1 |
| Hershey: | 37.4 |
| Elizabethtown: | 78.4 |
| New Cumberland: | 60.1 |
| Harrisburg: | 188.7 |
| Palmyra: | 69.9 |
| Camp Hill: | 137.3 |
| Enola: | 148.4 |
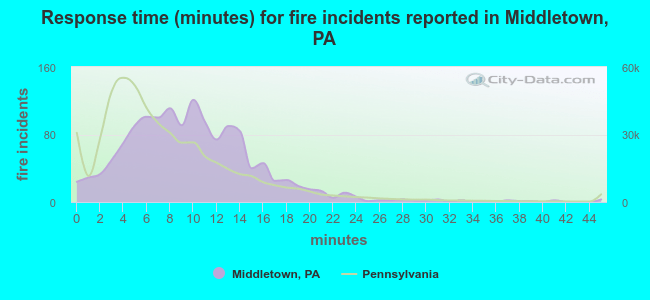 The median response time based on all reported fire incidents is 9 minutes. This is higher compared to the Pennsylvania median value.
The median response time in Middletown, PA compared to nearest cities:
(Note: Based on data for all years, including only cities with at least 500 fire incidents)
| Middletown: | 9 minutes |
| Hummelstown: | 10 minutes |
| Steelton: | 7 minutes |
| Hershey: | 8 minutes |
| Elizabethtown: | 9 minutes |
| New Cumberland: | 9 minutes |
| Harrisburg: | 6 minutes |
| Manchester: | 8 minutes |
| Palmyra: | 9 minutes |
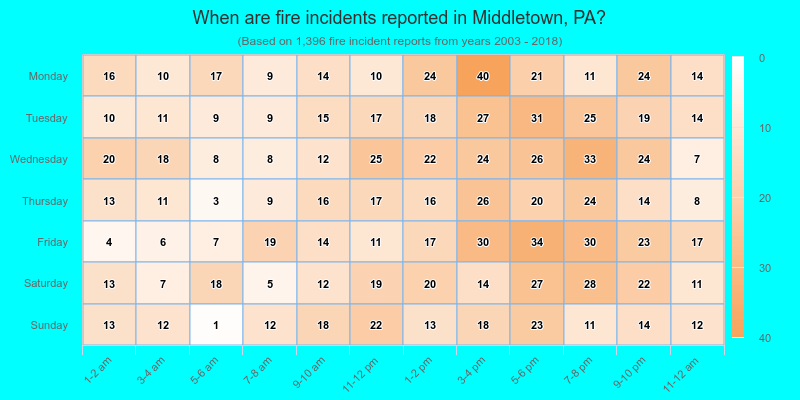
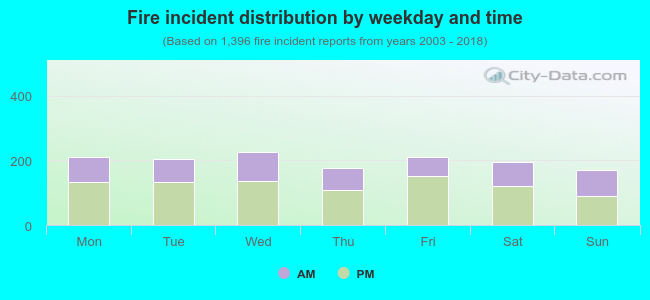 37.2% incidents where reported in the morning and 62.8% in the evening. The most fires (16.3%) took place on Wednesday, and the least (12.1%) on Sunday.
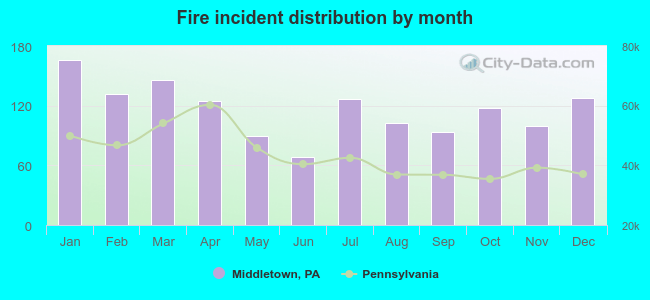 Based on the 1,396 incident reports from years 2003 - 2018 most fires (11.9%) took place during January, and the least (4.9%) in June.
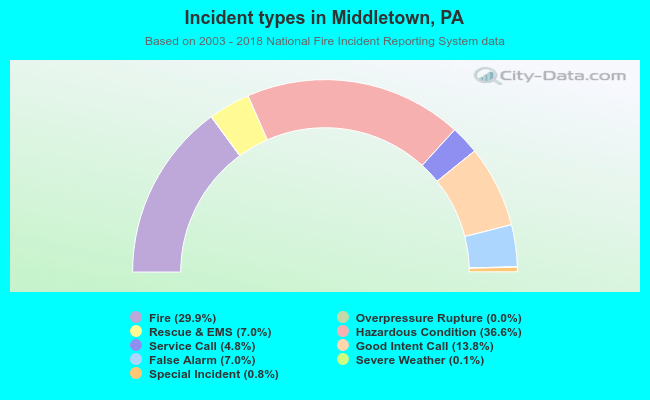 Out of all 4,675 cases reported during the years 2003 - 2018, the most belonged to the categories: Hazardous Condition (36.6%), Fire (29.9%), and Good Intent Call (13.8%).
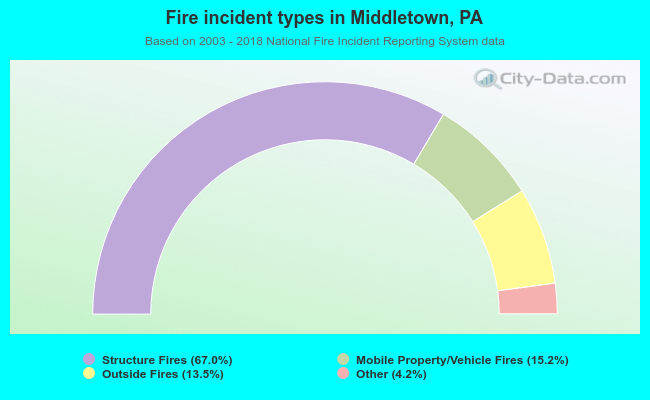 When looking into fire subcategories, the most reports belonged to: Structure Fires (67.0%), and Mobile Property/Vehicle Fires (15.2%).