New Cumberland: Fire Incidents, Pennsylvania (PA)
Where are fire incidents reported in New Cumberland, PA
Something went wrong! Please refresh the page.
|
| |||||||||||||||||||||||||||||||||||||||||||||||||||||||||||||||||||||||||||||||||||||||||||||||||||||||||||||
2003 - 2018 National Fire Incident Reporting System (NFIRS) incidents
- Incident types reported to NFIRS in New Cumberland, PA
- 99032.5%Hazardous Condition
- 76625.2%Fire
- 53217.5%Good Intent Call
- 45214.8%Rescue & EMS
- 1394.6%Service Call
- 1224.0%False Alarm
- 280.9%Severe Weather
- 100.3%Overpressure Rupture
- 50.2%Special Incident
- Fire incident types reported to NFIRS in New Cumberland, PA
- 49364.4%Structure Fires
- 10013.1%Other
- 9212.0%Outside Fires
- 8110.6%Mobile Property/Vehicle Fires
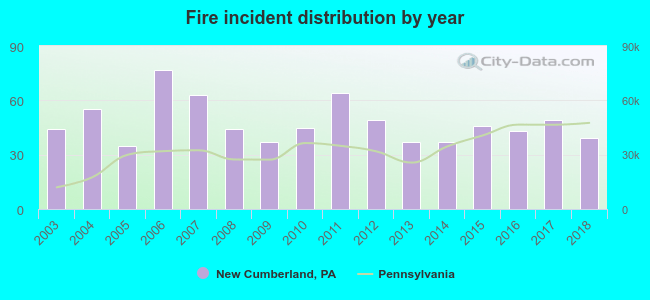 Based on the data from the years 2003 - 2018 the average number of fires per year is 48. The highest number of fires - 77 took place in 2006, and the least - 35 in 2005. The data has a dropping trend.
The average number of yearly fire incidents per 10k residents in New Cumberland, PA compared to nearest cities:
(Note: Based on data for the last 3 years, including only cities with population 5,000 and above)
| New Cumberland: | 60.1 |
| Steelton: | 64.1 |
| Harrisburg: | 188.7 |
| Camp Hill: | 137.3 |
| Enola: | 148.4 |
| Mechanicsburg: | 254.2 |
| Middletown: | 69.5 |
| Hershey: | 37.4 |
| Elizabethtown: | 78.4 |
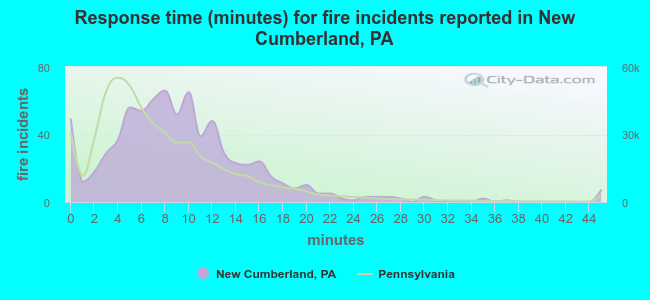 The median response time based on all reported fire incidents is 9 minutes. This is higher than the state median value.
The median response time in New Cumberland, PA compared to nearest cities:
(Note: Based on data for all years, including only cities with at least 500 fire incidents)
| New Cumberland: | 9 minutes |
| Steelton: | 7 minutes |
| Harrisburg: | 6 minutes |
| Camp Hill: | 8 minutes |
| Enola: | 8 minutes |
| Mechanicsburg: | 9 minutes |
| Middletown: | 9 minutes |
| Hummelstown: | 10 minutes |
| Dauphin: | 12 minutes |
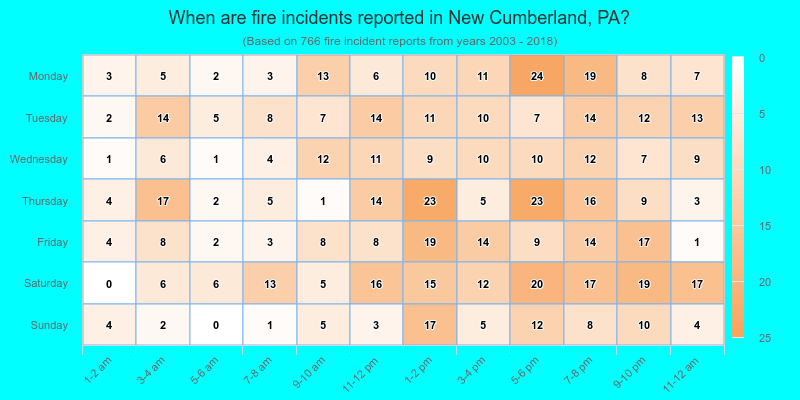
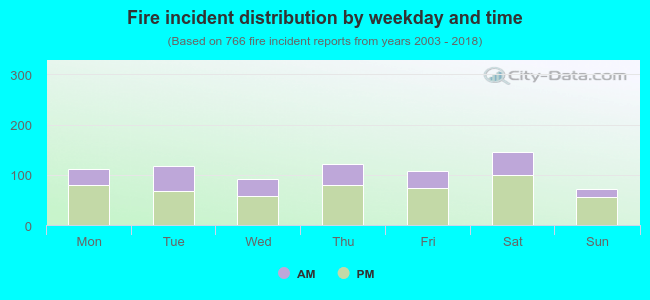 33.2% incidents where reported in the morning and 66.8% in the evening. The most fires (19.1%) took place on Saturday, and the least (9.3%) on Sunday.
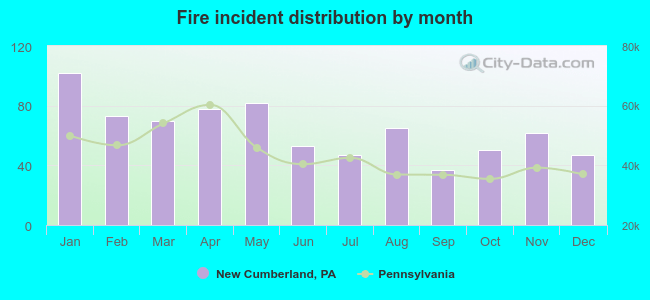 According to the 766 reports from years 2003 - 2018 most fires (13.3%) took place during January, and the least (4.8%) in September.
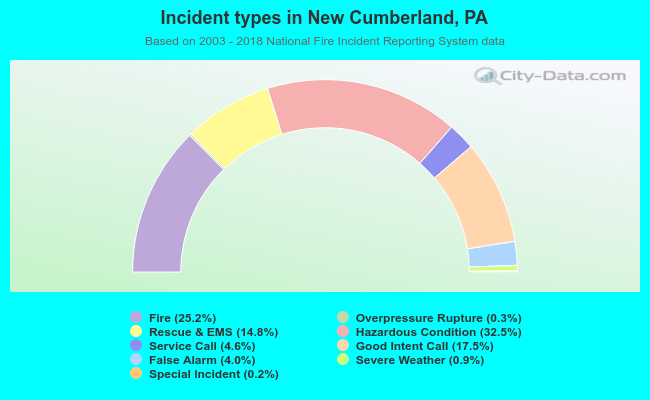 Out of all 3,044 cases reported during the years 2003 - 2018, the most belonged to the categories: Hazardous Condition (32.5%), Fire (25.2%), and Good Intent Call (17.5%).
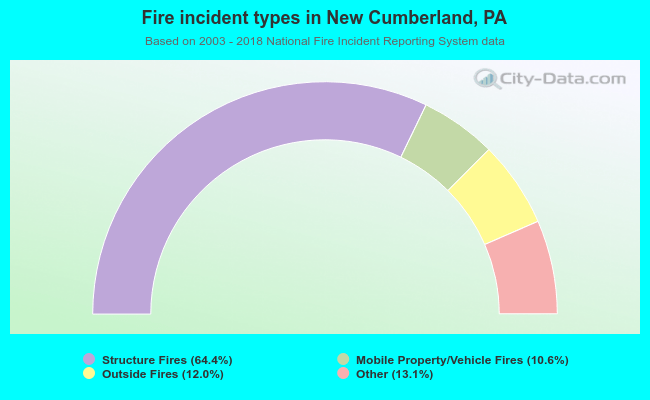 When looking into fire subcategories, the most reports belonged to: Structure Fires (64.4%), and Other (13.1%).