Lebanon: Fire Incidents, Pennsylvania (PA)
Where are fire incidents reported in Lebanon, PA
Something went wrong! Please refresh the page.
| Fire incidents reported | |
|---|---|
| Sreet name | Count |
| CUMBERLAND ST | 232 |
| LEHMAN ST | 228 |
| 9TH ST | 226 |
| WILLOW ST | 144 |
| 8TH ST | 142 |
| 10TH ST | 136 |
| WALNUT ST | 108 |
| 5TH ST | 96 |
| 7TH ST | 86 |
| WEIDMAN ST | 84 |
| 11TH ST | 78 |
| 16TH ST | 76 |
| CHESTNUT ST | 76 |
| 12TH ST | 64 |
| STATE DR | 64 |
| MAPLE ST | 58 |
| MIFFLIN ST | 58 |
| 6TH ST | 56 |
| GUILFORD ST | 54 |
| MOUNT WILSON RD | 50 |
| 5TH AVE | 42 |
| LINCOLN AVE | 42 |
| KERCHER AVE | 36 |
| CANAL ST | 34 |
| KEYSTONE DR | 34 |
| 4TH ST | 30 |
| QUENTIN RD | 30 |
| 2ND ST | 28 |
| CORNWALL RD | 28 |
| MOUNTVILLE DR | 28 |
| Other | 178 |
2003 - 2018 National Fire Incident Reporting System (NFIRS) incidents
- Incident types reported to NFIRS in Lebanon, PA
- 3,39329.3%Hazardous Condition
- 2,62622.7%Fire
- 1,79615.5%False Alarm
- 1,64814.2%Rescue & EMS
- 1,1039.5%Good Intent Call
- 8747.6%Service Call
- 730.6%Severe Weather
- 450.4%Special Incident
- 130.1%Overpressure Rupture
- Fire incident types reported to NFIRS in Lebanon, PA
- 1,83369.8%Structure Fires
- 45117.2%Outside Fires
- 1867.1%Mobile Property/Vehicle Fires
- 1565.9%Other
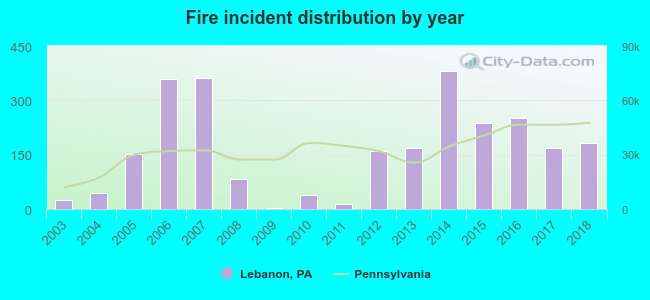 According to the data from the years 2003 - 2018 the average number of fires per year is 164. The highest number of fire incidents - 380 took place in 2014, and the least - 3 in 2009. The data has a rising trend.
The average number of yearly fire incidents per 10k residents in Lebanon, PA compared to nearest cities:
(Note: Based on data for the last 3 years, including only cities with population 5,000 and above)
| Lebanon: | 78.3 |
| Palmyra: | 69.9 |
| Hershey: | 37.4 |
| Lititz: | 50.4 |
| Elizabethtown: | 78.4 |
| Mount Joy: | 82.4 |
| Ephrata: | 53.0 |
| Middletown: | 69.5 |
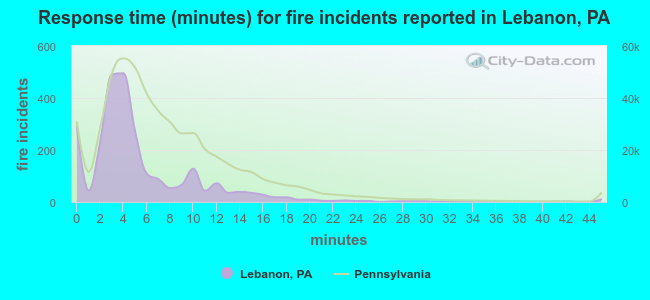 The median response time based on all reported fire incidents is 4 minutes. This is lower compared to the state median value.
The median response time in Lebanon, PA compared to nearest cities:
(Note: Based on data for all years, including only cities with at least 500 fire incidents)
| Lebanon: | 4 minutes |
| Annville: | 8 minutes |
| Myerstown: | 3 minutes |
| Palmyra: | 9 minutes |
| Manheim: | 10 minutes |
| Hershey: | 8 minutes |
| Lititz: | 9 minutes |
| Elizabethtown: | 9 minutes |
| Hummelstown: | 10 minutes |
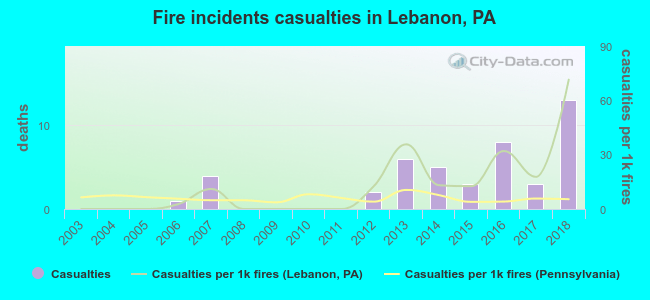 Based on the data from the years 2003 - 2018 the average number of fire-related yearly casualties is 3. The highest number of casualties - 13 took place in 2018, and the lowest - 0 in 2003. The data has a growing trend.
The average number of injuries per 1,000 fire incidents is 13. This indicator was the highest - 71 in 2018, and the lowest 0 in 2003. The trend for casualties per 1,000 fire incidents is growing. Compared to the state value the number of injuries per 1,000 incidents is much higher.
Based on the data from the years 2003 - 2018 the average number of fire-related yearly casualties is 3. The highest number of casualties - 13 took place in 2018, and the lowest - 0 in 2003. The data has a growing trend.
The average number of injuries per 1,000 fire incidents is 13. This indicator was the highest - 71 in 2018, and the lowest 0 in 2003. The trend for casualties per 1,000 fire incidents is growing. Compared to the state value the number of injuries per 1,000 incidents is much higher.Casualties per 1,000 incidents in Lebanon, PA compared to nearest cities:
(Note: Based on data for all years, including only cities with at least 500 fire incidents)
| Lebanon: | 17.1 |
| Annville: | 3.3 |
| Myerstown: | 0.0 |
| Palmyra: | 7.3 |
| Manheim: | 3.5 |
| Hershey: | 14.8 |
| Lititz: | 2.7 |
| Elizabethtown: | 3.1 |
| Hummelstown: | 7.1 |
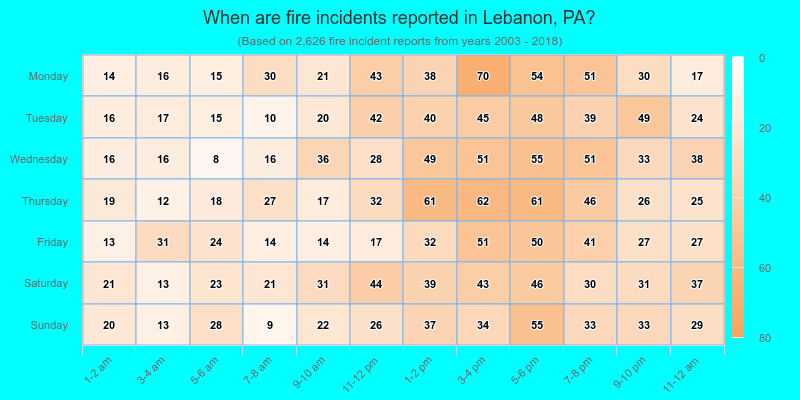
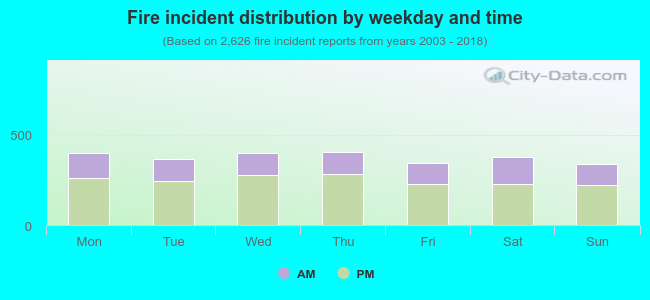 33.8% incidents where reported in the morning and 66.2% in the evening. The most fires (15.5%) took place on Thursday, and the least (12.9%) on Sunday.
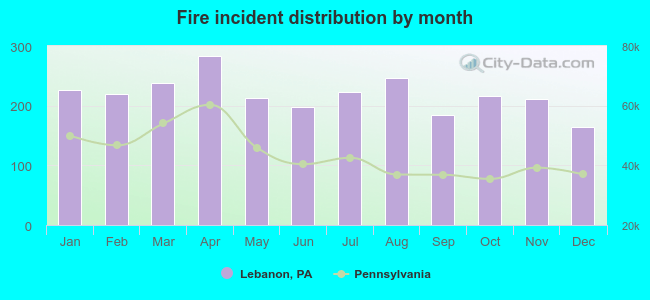 Based on the 2,626 incident reports from years 2003 - 2018 most fires (10.8%) took place during April, and the least (6.3%) in December.
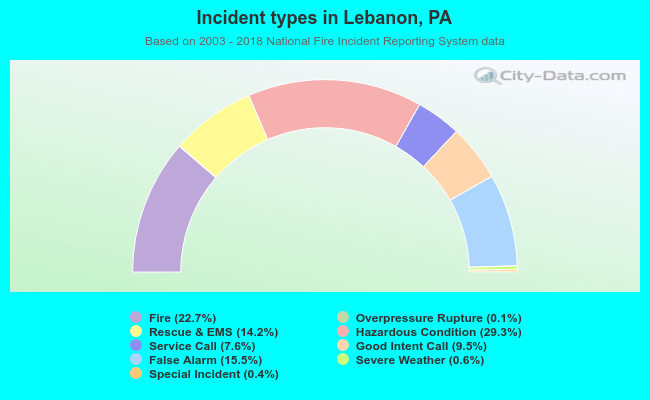 Out of all 11,571 cases reported during the years 2003 - 2018, the most belonged to the categories: Hazardous Condition (29.3%), Fire (22.7%), and False Alarm (15.5%).
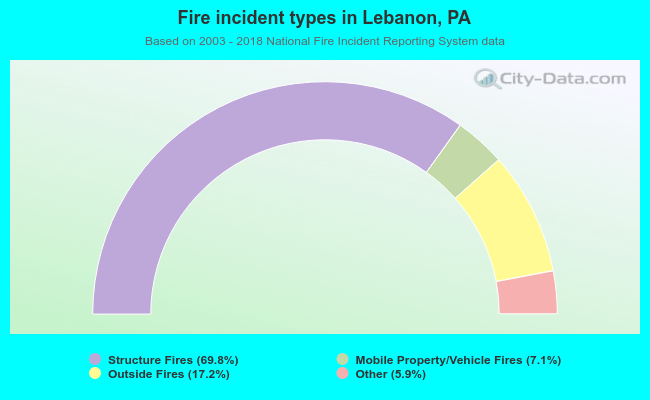 When looking into fire subcategories, the most incidents belonged to: Structure Fires (69.8%), and Outside Fires (17.2%).