Camp Hill: Fire Incidents, Pennsylvania (PA)
Where are fire incidents reported in Camp Hill, PA
Something went wrong! Please refresh the page.
| Fire incidents reported | |
|---|---|
| Sreet name | Count |
| MARKET ST | 168 |
| ERFORD RD | 112 |
| SENATE AVE | 82 |
| LISBURN RD | 72 |
| 21ST ST | 66 |
| GETTYSBURG RD | 62 |
| CARLISLE RD | 52 |
| TRINDLE RD | 52 |
| HUMMEL AVE | 50 |
| CEDAR RUN DR | 48 |
| RICHLAND LN | 46 |
| SIMPSON FERRY RD | 44 |
| 24TH ST | 40 |
| RT 581 | 40 |
| POPLAR CHURCH RD | 38 |
| HARTZDALE DR | 36 |
| 32ND ST | 34 |
| CHESTNUT ST | 34 |
| COLUMBUS AVE | 34 |
| STEPHEN RD | 34 |
| YVERDON DR | 34 |
| 18TH ST | 32 |
| SLATE HILL RD | 32 |
| SPANGLER RD | 32 |
| 581 RT | 30 |
| MARSHALL DR | 30 |
| CAPITAL CITY MALL DR | 28 |
| LAMP POST LN | 28 |
| SECOND ST | 28 |
| 17TH ST | 26 |
| Other | 510 |
2003 - 2018 National Fire Incident Reporting System (NFIRS) incidents
- Incident types reported to NFIRS in Camp Hill, PA
- 1,95428.2%Fire
- 1,63823.7%Hazardous Condition
- 1,04615.1%Good Intent Call
- 1,00714.6%False Alarm
- 87412.6%Rescue & EMS
- 3144.5%Service Call
- 520.8%Severe Weather
- 190.3%Special Incident
- 160.2%Overpressure Rupture
- Fire incident types reported to NFIRS in Camp Hill, PA
- 1,12157.4%Structure Fires
- 39720.3%Other
- 22611.6%Outside Fires
- 21010.7%Mobile Property/Vehicle Fires
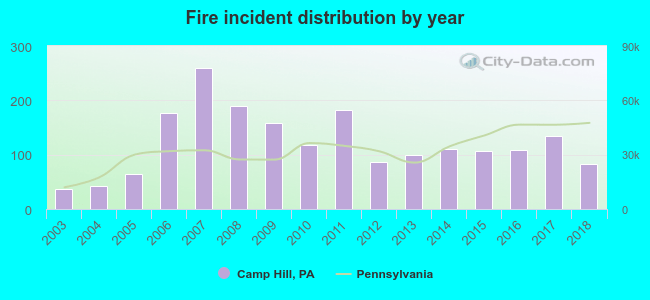 Based on the data from the years 2003 - 2018 the average number of fire incidents per year is 122. The highest number of reported fire incidents - 259 took place in 2007, and the least - 37 in 2003. The data has an increasing trend.
The average number of yearly fire incidents per 10k residents in Camp Hill, PA compared to nearest cities:
(Note: Based on data for the last 3 years, including only cities with population 5,000 and above)
| Camp Hill: | 137.3 |
| New Cumberland: | 60.1 |
| Harrisburg: | 188.7 |
| Enola: | 148.4 |
| Mechanicsburg: | 254.2 |
| Steelton: | 64.1 |
| Middletown: | 69.5 |
| Carlisle: | 88.1 |
| Hershey: | 37.4 |
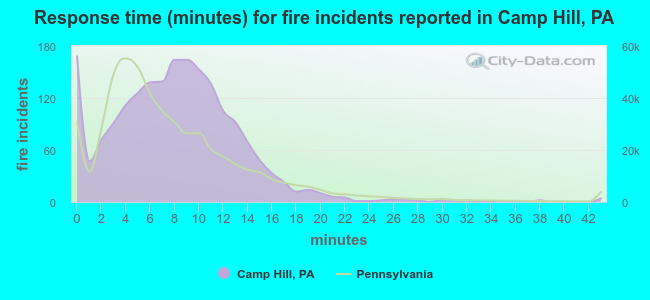 The median response time based on all reported fire incidents is 8 minutes. This is higher than the Pennsylvania median value.
The median response time in Camp Hill, PA compared to nearest cities:
(Note: Based on data for all years, including only cities with at least 500 fire incidents)
| Camp Hill: | 8 minutes |
| New Cumberland: | 9 minutes |
| Harrisburg: | 6 minutes |
| Enola: | 8 minutes |
| Mechanicsburg: | 9 minutes |
| Steelton: | 7 minutes |
| Dauphin: | 12 minutes |
| Dillsburg: | 10 minutes |
| Middletown: | 9 minutes |
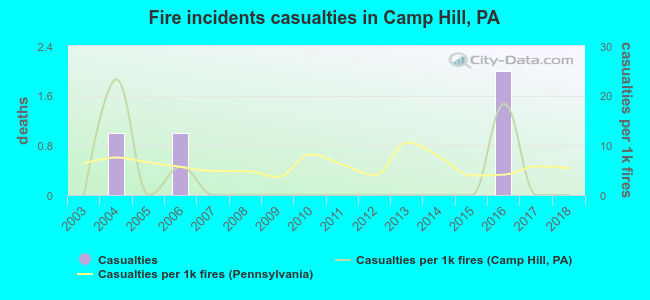 Based on the reports from the years 2003 - 2018 the average number of fire-related casualties per year is 0. The highest number of reported injuries - 2 took place in 2016, and the lowest - 0 in 2003. The data has a constant trend.
The average number of injuries per 1,000 fire incidents is 3. This indicator was the highest - 23 in 2004, and the lowest 0 in 2003. The trend for injuries per 1,000 fire incidents is constant. Compared to the state value the number of casualties per 1,000 incidents is much lower.
Based on the reports from the years 2003 - 2018 the average number of fire-related casualties per year is 0. The highest number of reported injuries - 2 took place in 2016, and the lowest - 0 in 2003. The data has a constant trend.
The average number of injuries per 1,000 fire incidents is 3. This indicator was the highest - 23 in 2004, and the lowest 0 in 2003. The trend for injuries per 1,000 fire incidents is constant. Compared to the state value the number of casualties per 1,000 incidents is much lower.Casualties per 1,000 incidents in Camp Hill, PA compared to nearest cities:
(Note: Based on data for all years, including only cities with at least 500 fire incidents)
| Camp Hill: | 2.0 |
| New Cumberland: | 1.3 |
| Harrisburg: | 6.2 |
| Enola: | 0.8 |
| Mechanicsburg: | 1.4 |
| Steelton: | 4.5 |
| Dauphin: | 0.0 |
| Dillsburg: | 0.0 |
| Middletown: | 0.0 |
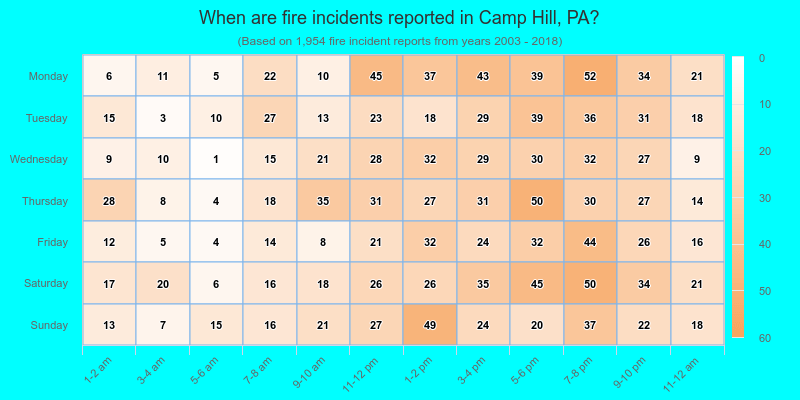
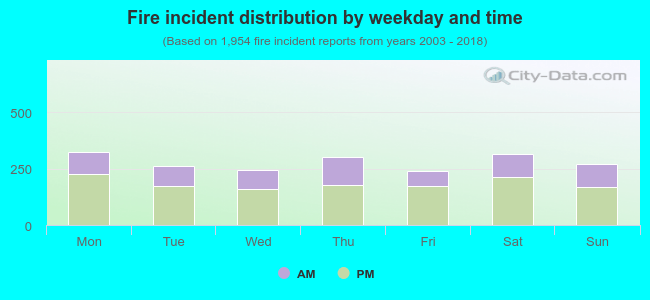 34.0% incidents where reported in the morning and 66.0% in the evening. The most fires (16.6%) took place on Monday, and the least (12.2%) on Friday.
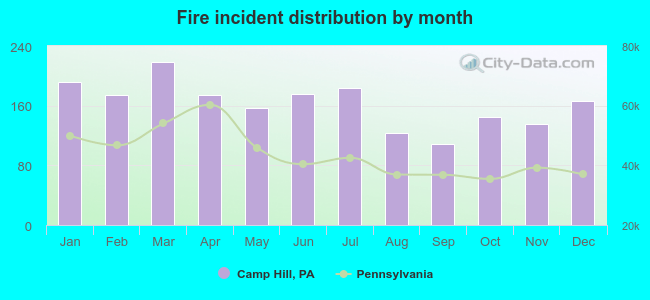 According to the 1,954 reports from years 2003 - 2018 most fires (11.2%) took place during March, and the least (5.6%) in September.
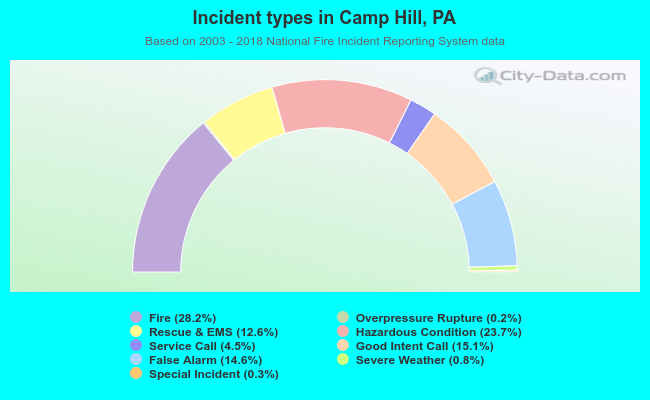 Out of all 6,920 cases reported during the years 2003 - 2018, the most belonged to the categories: Fire (28.2%), Hazardous Condition (23.7%), and Good Intent Call (15.1%).
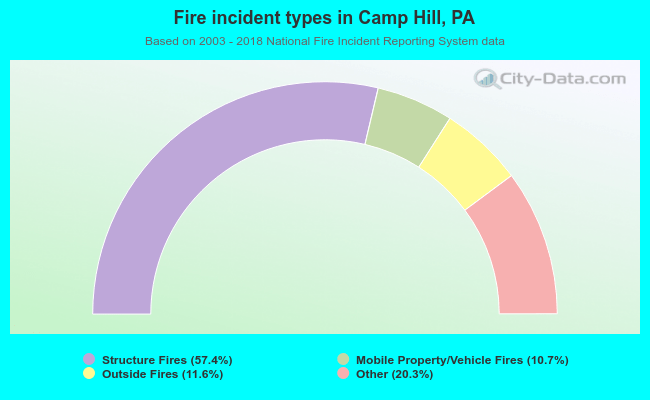 When looking into fire subcategories, the most incidents belonged to: Structure Fires (57.4%), and Other (20.3%).