Mineral Wells: Fire Incidents, Texas (TX)
Where are fire incidents reported in Mineral Wells, TX
Something went wrong! Please refresh the page.
| Fire incidents reported | |
|---|---|
| Sreet name | Count |
| FM 1195 | 148 |
| OAK AVE | 140 |
| CASS HOLLAND RD | 134 |
| HWY 281 | 134 |
| 4TH AVE | 106 |
| 2ND ST | 100 |
| HWY 180 | 100 |
| FM 2256 | 98 |
| 2ND AVE | 94 |
| 10TH ST | 90 |
| 5TH AVE | 90 |
| HUBBARD ST | 74 |
| VILLAGE BEND RD | 70 |
| 1ST ST | 68 |
| FM 1821 | 68 |
| 3RD AVE | 66 |
| HWY 281 N | 66 |
| 3RD ST | 62 |
| SARTAIN RD | 58 |
| 6TH ST | 56 |
| 25TH AVE | 52 |
| 6TH AVE | 52 |
| 9TH ST | 48 |
| MILLSAP HWY | 48 |
| 7TH ST | 44 |
| 15TH ST | 42 |
| 1ST AVE | 42 |
| 22ND ST | 42 |
| HWY 180 E | 42 |
| AIRPORT RD | 40 |
| Other | 567 |
2002 - 2018 National Fire Incident Reporting System (NFIRS) incidents
- Incident types reported to NFIRS in Mineral Wells, TX
- 9,85057.9%Rescue & EMS
- 2,84116.7%Fire
- 1,4848.7%Service Call
- 1,4078.3%Hazardous Condition
- 8535.0%Good Intent Call
- 5203.1%False Alarm
- 320.2%Special Incident
- Fire incident types reported to NFIRS in Mineral Wells, TX
- 1,67759.0%Outside Fires
- 71425.1%Structure Fires
- 34712.2%Mobile Property/Vehicle Fires
- 1033.6%Other
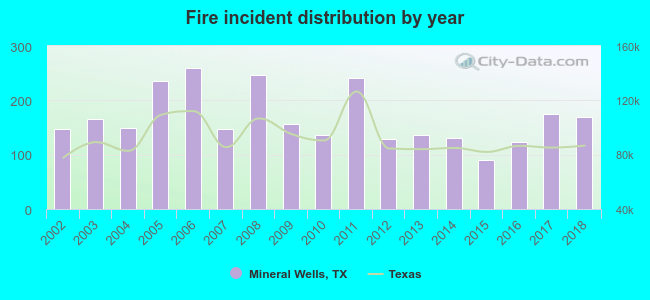 Based on the data from the years 2002 - 2018 the average number of fire incidents per year is 167. The highest number of reported fire incidents - 260 took place in 2006, and the least - 91 in 2015. The data has an increasing trend.
The average number of yearly fire incidents per 10k residents in Mineral Wells, TX compared to nearest cities:
(Note: Based on data for the last 3 years, including only cities with population 5,000 and above)
| Mineral Wells: | 101.5 |
| Weatherford: | 133.4 |
| Granbury: | 357.9 |
| Azle: | 122.9 |
| Bridgeport: | 103.1 |
| Graham: | 46.3 |
| Briar: | 20.6 |
| White Settlement: | 45.4 |
| Eagle Mountain: | 3.4 |
 The median response time based on all reported fire incidents is 7 minutes. This is similar to the state median value.
The median response time in Mineral Wells, TX compared to nearest cities:
(Note: Based on data for all years, including only cities with at least 500 fire incidents)
| Mineral Wells: | 7 minutes |
| Millsap: | 12 minutes |
| Weatherford: | 9 minutes |
| Willow Park: | 5 minutes |
| Springtown: | 9 minutes |
| Aledo: | 9 minutes |
| Tolar: | 11 minutes |
| Granbury: | 12 minutes |
| Azle: | 9 minutes |
 According to the reports from the years 2002 - 2018 the average number of fire-related fatalities per year is 0. The highest number of deaths - 1 took place in 2004, and the lowest - 0 in 2002. The data has a constant trend.
The average number of fatalities per 1,000 fires is 1. This indicator was the highest - 8 in 2014, and the lowest 0 in 2002. The trend for fatalities per 1,000 incidents is constant. Compared to the Texas value the number of deaths per 1,000 fires is lower.
According to the reports from the years 2002 - 2018 the average number of fire-related fatalities per year is 0. The highest number of deaths - 1 took place in 2004, and the lowest - 0 in 2002. The data has a constant trend.
The average number of fatalities per 1,000 fires is 1. This indicator was the highest - 8 in 2014, and the lowest 0 in 2002. The trend for fatalities per 1,000 incidents is constant. Compared to the Texas value the number of deaths per 1,000 fires is lower.Deaths per 1,000 incidents in Mineral Wells, TX compared to nearest cities:
(Note: Based on data for all years, including only cities with at least 2,500 fire incidents)
| Mineral Wells: | 1.1 |
| Weatherford: | 0.6 |
| Springtown: | 0.3 |
| Granbury: | 0.0 |
| Azle: | 0.7 |
| Stephenville: | 0.0 |
| Fort Worth: | 1.9 |
| Haltom City: | 1.4 |
| Burleson: | 0.8 |
 According to the reports from the years 2002 - 2018 the average number of fire-related yearly casualties is 5. The highest number of injuries - 14 took place in 2004, and the lowest - 0 in 2018. The data has a decreasing trend.
The average number of injuries per 1,000 fires is 29. This indicator was the highest - 93 in 2004, and the lowest 0 in 2018. The trend for casualties per 1,000 fire incidents is dropping. Compared to the Texas value the number of injuries per 1,000 fire incidents is much higher.
According to the reports from the years 2002 - 2018 the average number of fire-related yearly casualties is 5. The highest number of injuries - 14 took place in 2004, and the lowest - 0 in 2018. The data has a decreasing trend.
The average number of injuries per 1,000 fires is 29. This indicator was the highest - 93 in 2004, and the lowest 0 in 2018. The trend for casualties per 1,000 fire incidents is dropping. Compared to the Texas value the number of injuries per 1,000 fire incidents is much higher.Casualties per 1,000 incidents in Mineral Wells, TX compared to nearest cities:
(Note: Based on data for all years, including only cities with at least 500 fire incidents)
| Mineral Wells: | 27.8 |
| Millsap: | 0.0 |
| Weatherford: | 1.7 |
| Willow Park: | 1.3 |
| Springtown: | 0.3 |
| Aledo: | 0.0 |
| Tolar: | 2.2 |
| Granbury: | 0.7 |
| Azle: | 2.7 |
 25.6% incidents where reported in the morning and 74.4% in the evening. The most fires (17.6%) took place on Sunday, and the least (12.4%) on Friday.
 Based on the 2,841 incident reports from years 2002 - 2018 most fires (14.0%) took place during January, and the least (5.9%) in November.
 Out of all 17,014 cases reported during the years 2002 - 2018, the most belonged to the categories: Rescue & EMS (57.9%), Fire (16.7%), and Service Call (8.7%).
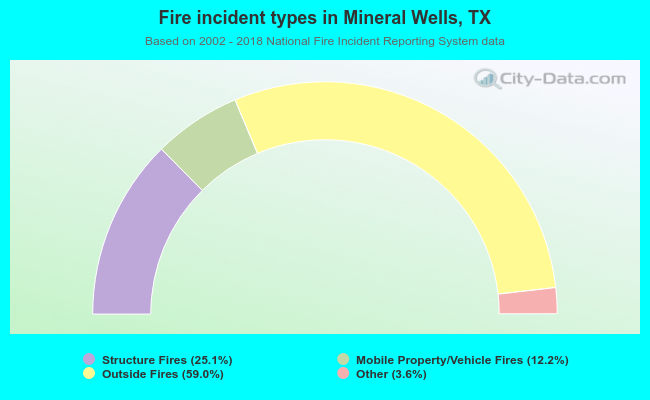 When looking into fire subcategories, the most reports belonged to: Outside Fires (59.0%), and Structure Fires (25.1%).