New Ipswich: Fire Incidents, New Hampshire (NH)
Where are fire incidents reported in New Ipswich, NH
Something went wrong! Please refresh the page.
|
| |||||||||||||||||||||||||||||||||||||||||||||||||||||||||||||||||||||||||||||||||||||||||||||||||||||||||||||
2002 - 2018 National Fire Incident Reporting System (NFIRS) incidents
- Incident types reported to NFIRS in New Ipswich, NH
- 40430.9%Fire
- 24318.6%Hazardous Condition
- 23217.8%Rescue & EMS
- 18013.8%Service Call
- 14911.4%False Alarm
- 876.7%Good Intent Call
- 50.4%Overpressure Rupture
- 50.4%Special Incident
- Fire incident types reported to NFIRS in New Ipswich, NH
- 19448.0%Structure Fires
- 15037.1%Outside Fires
- 338.2%Mobile Property/Vehicle Fires
- 276.7%Other
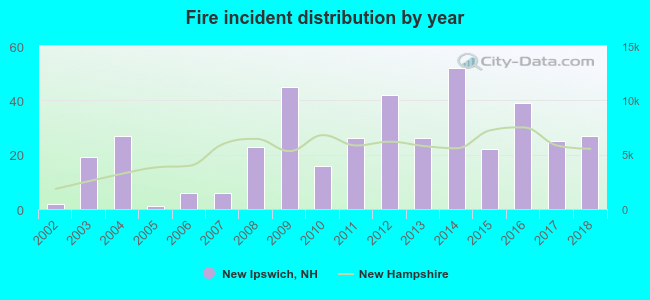 According to the data from the years 2002 - 2018 the average number of fires per year is 24. The highest number of reported fire incidents - 52 took place in 2014, and the least - 1 in 2005. The data has a rising trend.
The average number of yearly fire incidents per 10k residents in New Ipswich, NH compared to nearest cities:
(Note: Based on data for the last 3 years, including only cities with population 5,000 and above)
| New Ipswich: | 59.5 |
| Rindge: | 53.8 |
| Milford: | 47.2 |
| Hollis: | 26.0 |
| Amherst: | 21.4 |
| New Boston: | 67.0 |
| Merrimack: | 28.8 |
| Nashua: | 30.6 |
| Bedford: | 24.5 |

 43.8% incidents where reported in the morning and 56.2% in the evening. The most fires (18.8%) took place on Saturday, and the least (10.1%) on Thursday.
 According to the 404 fire incident reports from years 2002 - 2018 most fires (13.1%) took place during May, and the least (4.2%) in September.
 Out of all 1,306 cases reported during the years 2002 - 2018, the most belonged to the categories: Fire (30.9%), Hazardous Condition (18.6%), and Rescue & EMS (17.8%).
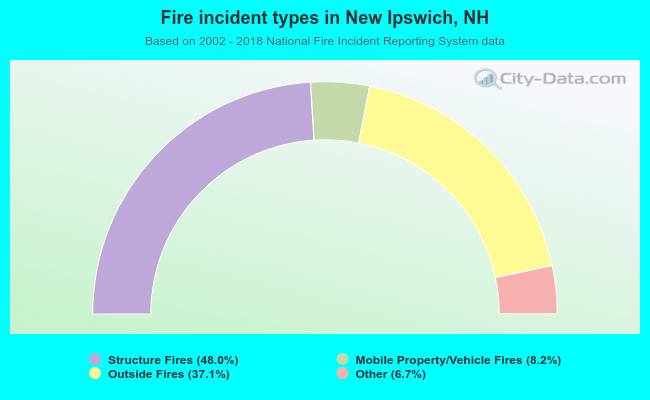 When looking into fire subcategories, the most reports belonged to: Structure Fires (48.0%), and Outside Fires (37.1%).