Foley: Fire Incidents, Alabama (AL)
Where are fire incidents reported in Foley, AL
Something went wrong! Please refresh the page.
| Fire incidents reported | |
|---|---|
| Sreet name | Count |
| MCKENZIE ST | 432 |
| JUNIPER ST | 138 |
| COUNTY RD | 135 |
| GRANTHAM RD | 127 |
| KELLER RD | 115 |
| DOC MCDUFFIE RD | 114 |
| 59 HWY | 112 |
| LAUREL AVE | 112 |
| HWY 98 | 111 |
| 98 HWY | 108 |
| HWY 59 | 99 |
| LAURENT RD | 89 |
| COUNTY RD 12 | 85 |
| FOLEY BEACH EXPRESS | 83 |
| RIVER RD | 77 |
| UNDERWOOD RD | 77 |
| BAY RD | 75 |
| COUNTY ROAD 26 | 75 |
| MAGNOLIA SPRINGS HWY | 75 |
| US HIGHWAY 98 | 70 |
| COUNTY ROAD 65 | 69 |
| LYMON LN | 69 |
| CEDAR ST | 66 |
| U S HWY | 65 |
| AIRPORT RD | 63 |
| BRINKS WILLIS RD | 62 |
| SWIFT CHURCH RD | 61 |
| COUNTY RD 55 | 60 |
| COUNTY RD 65 | 60 |
| MICHIGAN AVE | 60 |
2004 - 2018 National Fire Incident Reporting System (NFIRS) incidents
- Incident types reported to NFIRS in Foley, AL
- 3,45837.7%Rescue & EMS
- 2,05522.4%Fire
- 99710.9%Hazardous Condition
- 93410.2%Good Intent Call
- 8859.7%Service Call
- 7558.2%False Alarm
- 440.5%Severe Weather
- 230.3%Special Incident
- 170.2%Overpressure Rupture
- Fire incident types reported to NFIRS in Foley, AL
- 1,06651.9%Outside Fires
- 53926.3%Structure Fires
- 36417.7%Mobile Property/Vehicle Fires
- 844.1%Other
 Based on the data from the years 2004 - 2018 the average number of fires per year is 137. The highest number of reported fires - 208 took place in 2006, and the least - 96 in 2011. The data has a dropping trend.
The average number of yearly fire incidents per 10k residents in Foley, AL compared to nearest cities:
(Note: Based on data for the last 3 years, including only cities with population 5,000 and above)
| Foley: | 80.7 |
| Gulf Shores: | 69.9 |
| Robertsdale: | 38.7 |
| Orange Beach: | 61.0 |
| Fairhope: | 26.4 |
| Daphne: | 35.3 |
| Spanish Fort: | 34.2 |
| Theodore: | 115.3 |
| Mobile: | 15.4 |
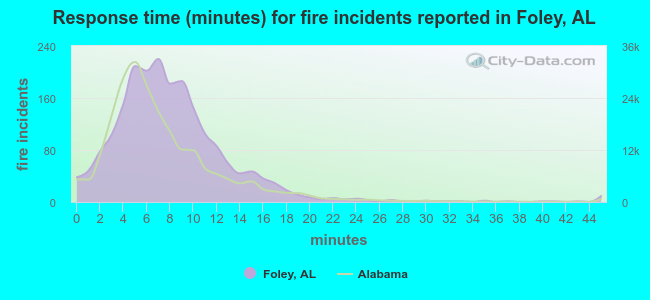 The median response time based on all reported fire incidents is 7 minutes. This is about the same as the state median value.
The median response time in Foley, AL compared to nearest cities:
(Note: Based on data for all years, including only cities with at least 500 fire incidents)
| Foley: | 7 minutes |
| Gulf Shores: | 5 minutes |
| Orange Beach: | 5 minutes |
| Fairhope: | 8 minutes |
| Daphne: | 6 minutes |
| Theodore: | 7 minutes |
| Mobile: | 7 minutes |
| Bay Minette: | 5 minutes |
| Prichard: | 5 minutes |
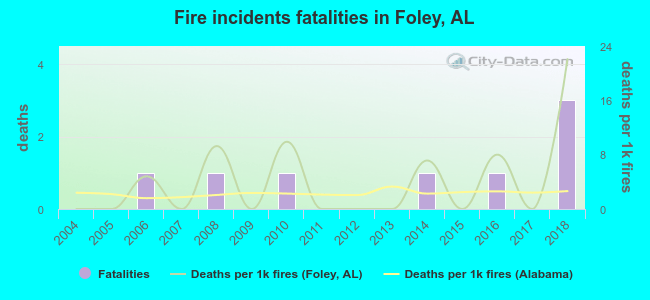 Based on the reports from the years 2004 - 2018 the average number of fire-related yearly deaths is 1. The highest number of reported deaths - 3 took place in 2018, and the lowest - 0 in 2004. The data has a rising trend.
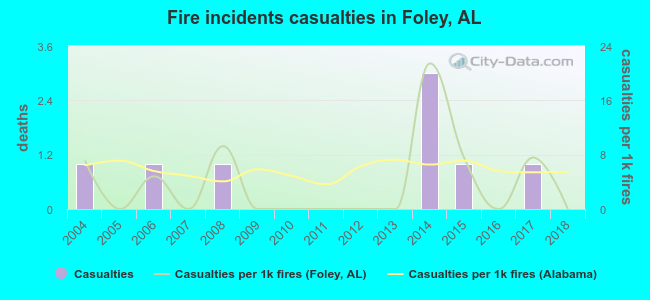 Based on the reports from the years 2004 - 2018 the average number of fire-related yearly casualties is 1. The highest number of reported casualties - 3 took place in 2014, and the lowest - 0 in 2005. The data has a declining trend.
The average number of injuries per 1,000 fires is 4. This indicator was the highest - 21 in 2014, and the lowest 0 in 2005. The trend for injuries per 1,000 fires is dropping. Compared to the state value the number of injuries per 1,000 incidents is lower.
Based on the reports from the years 2004 - 2018 the average number of fire-related yearly casualties is 1. The highest number of reported casualties - 3 took place in 2014, and the lowest - 0 in 2005. The data has a declining trend.
The average number of injuries per 1,000 fires is 4. This indicator was the highest - 21 in 2014, and the lowest 0 in 2005. The trend for injuries per 1,000 fires is dropping. Compared to the state value the number of injuries per 1,000 incidents is lower.Casualties per 1,000 incidents in Foley, AL compared to nearest cities:
(Note: Based on data for all years, including only cities with at least 500 fire incidents)
| Foley: | 3.9 |
| Gulf Shores: | 0.9 |
| Orange Beach: | 2.6 |
| Fairhope: | 2.8 |
| Daphne: | 14.1 |
| Theodore: | 0.0 |
| Mobile: | 1.2 |
| Bay Minette: | 2.3 |
| Prichard: | 0.0 |
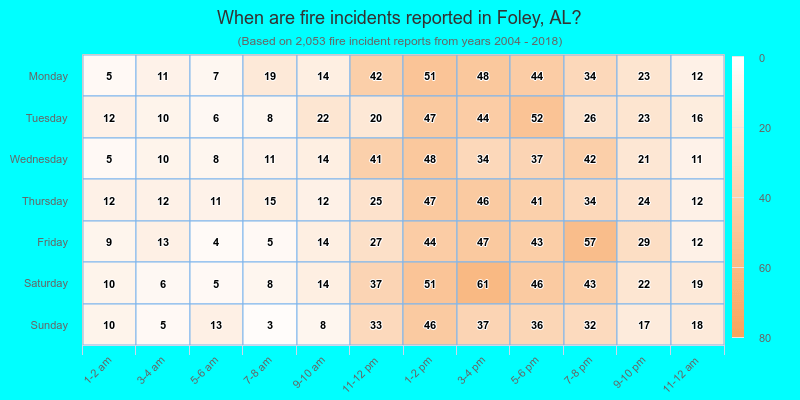
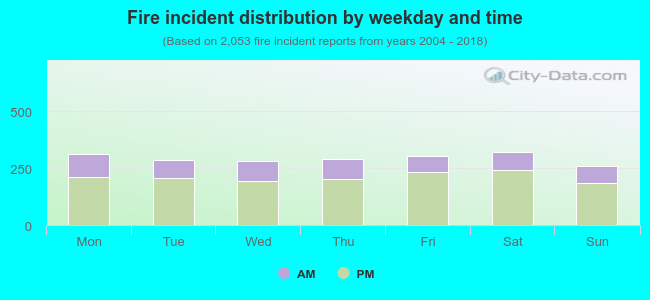 28.1% incidents where reported in the morning and 71.9% in the evening. The most fires (15.7%) took place on Saturday, and the least (12.6%) on Sunday.
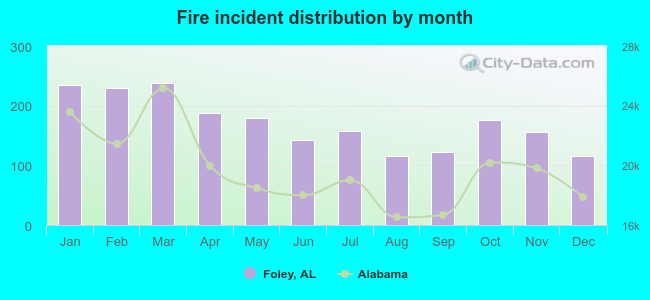 According to the 2,053 fires from years 2004 - 2018 most fires (11.6%) took place during March, and the least (5.6%) in August.
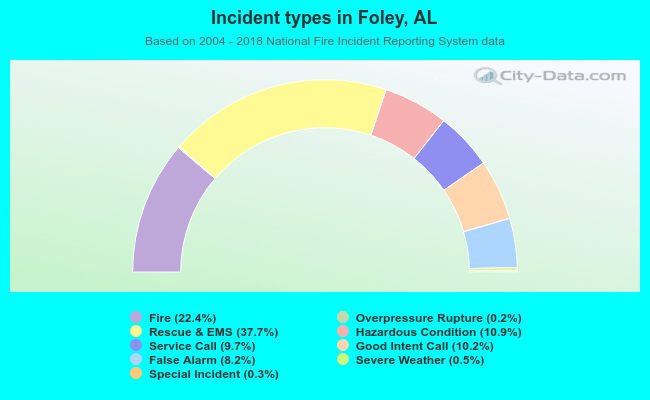 Out of all 9,168 cases reported during the years 2004 - 2018, the most belonged to the categories: Rescue & EMS (37.7%), Fire (22.4%), and Hazardous Condition (10.9%).
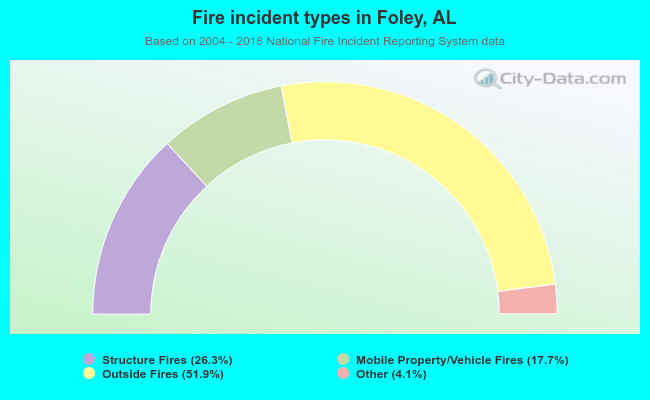 When looking into fire subcategories, the most incidents belonged to: Outside Fires (51.9%), and Structure Fires (26.3%).