Orange Beach: Fire Incidents, Alabama (AL)
Where are fire incidents reported in Orange Beach, AL
Something went wrong! Please refresh the page.
| Fire incidents reported | |
|---|---|
| Sreet name | Count |
| PERDIDO BEACH BLVD | 1,296 |
| CANAL RD | 406 |
| ONO BLVD | 74 |
| RIVER RD | 71 |
| GULF BAY RD | 56 |
| RUSSIAN RD | 56 |
| MARINA RD | 55 |
| ORANGE BEACH BLVD | 51 |
| ROSCOE RD | 45 |
| BAY LA LAUNCH AVE | 28 |
| LOOK ROOK RD | 24 |
| COTTON BAYOU DR | 23 |
| BAY CIR | 22 |
| BAYSHORE DR | 20 |
| ONO NORTH LOOP | 20 |
| WHARF PKWY | 20 |
| WILSON BLVD | 20 |
| AZALEA ST | 19 |
| BAY DR | 19 |
| WOLF BAY TER | 19 |
| PENSACOLA AVE | 18 |
| BEAVER CREEK LN | 16 |
| ARMADILLO AVE | 15 |
| HOLDER RD | 15 |
| LAUDER LN | 15 |
| MAIN ST | 15 |
| BROWN LN | 14 |
| BURKART DR | 14 |
| EASY ST | 14 |
| MARTINIQUE DR | 14 |
2002 - 2018 National Fire Incident Reporting System (NFIRS) incidents
- Incident types reported to NFIRS in Orange Beach, AL
- 7,49554.4%Rescue & EMS
- 2,26916.5%False Alarm
- 1,44710.5%Service Call
- 9276.7%Good Intent Call
- 7775.6%Fire
- 7165.2%Hazardous Condition
- 1341.0%Special Incident
- 140.1%Overpressure Rupture
- Fire incident types reported to NFIRS in Orange Beach, AL
- 32742.1%Outside Fires
- 25332.6%Structure Fires
- 13317.1%Mobile Property/Vehicle Fires
- 648.2%Other
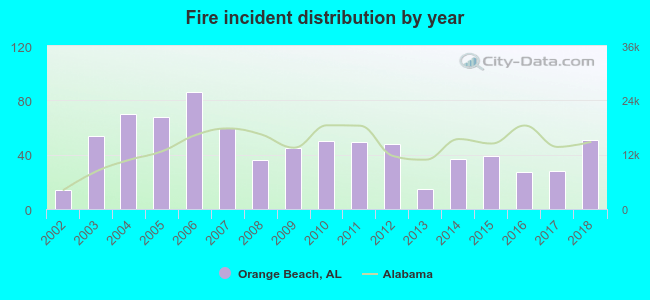 According to the data from the years 2002 - 2018 the average number of fire incidents per year is 46. The highest number of fire incidents - 86 took place in 2006, and the least - 14 in 2002. The data has a growing trend.
The average number of yearly fire incidents per 10k residents in Orange Beach, AL compared to nearest cities:
(Note: Based on data for the last 3 years, including only cities with population 5,000 and above)
| Orange Beach: | 61.0 |
| Gulf Shores: | 69.9 |
| Foley: | 80.7 |
| Robertsdale: | 38.7 |
| Fairhope: | 26.4 |
| Daphne: | 35.3 |
| Spanish Fort: | 34.2 |
| Theodore: | 115.3 |
| Mobile: | 15.4 |
 The median response time based on all reported fire incidents is 5 minutes. This is lower compared to the state median value.
The median response time in Orange Beach, AL compared to nearest cities:
(Note: Based on data for all years, including only cities with at least 500 fire incidents)
| Orange Beach: | 5 minutes |
| Gulf Shores: | 5 minutes |
| Foley: | 7 minutes |
| Fairhope: | 8 minutes |
| Daphne: | 6 minutes |
| Theodore: | 7 minutes |
| Mobile: | 7 minutes |
| Bay Minette: | 5 minutes |
| Prichard: | 5 minutes |
 34.5% incidents where reported in the morning and 65.5% in the evening. The most fires (15.6%) took place on Saturday, and the least (13.3%) on Thursday.
 According to the 777 fire incidents from years 2002 - 2018 most fires (13.9%) took place during June, and the least (4.5%) in December.
 Out of all 13,788 cases reported during the years 2002 - 2018, the most belonged to the categories: Rescue & EMS (54.4%), False Alarm (16.5%), and Service Call (10.5%).
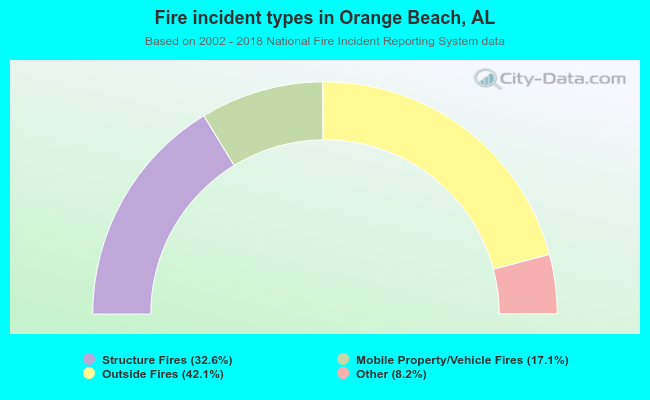 When looking into fire subcategories, the most incidents belonged to: Outside Fires (42.1%), and Structure Fires (32.6%).