Robertsdale: Fire Incidents, Alabama (AL)
Where are fire incidents reported in Robertsdale, AL
Something went wrong! Please refresh the page.
|
| |||||||||||||||||||||||||||||||||||||||||||||||||||||||||||||||||||||||||||||||||||||||||||||||||||||||||||||
2008 - 2018 National Fire Incident Reporting System (NFIRS) incidents
- Incident types reported to NFIRS in Robertsdale, AL
- 26234.9%Rescue & EMS
- 20527.3%Fire
- 15020.0%Good Intent Call
- 7510.0%False Alarm
- 324.3%Hazardous Condition
- 233.1%Service Call
- 30.4%Special Incident
- Fire incident types reported to NFIRS in Robertsdale, AL
- 9144.4%Structure Fires
- 7637.1%Outside Fires
- 2914.1%Mobile Property/Vehicle Fires
- 94.4%Other
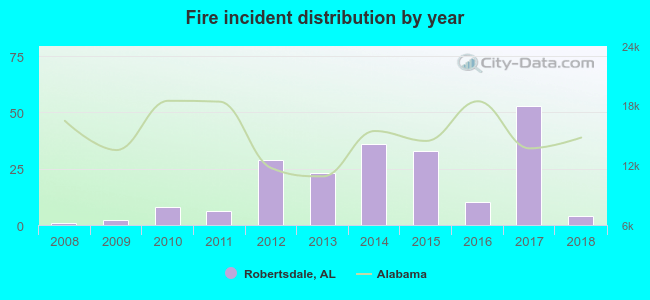 Based on the data from the years 2008 - 2018 the average number of fire incidents per year is 19. The highest number of reported fire incidents - 53 took place in 2017, and the least - 1 in 2008. The data has a growing trend.
The average number of yearly fire incidents per 10k residents in Robertsdale, AL compared to nearest cities:
(Note: Based on data for the last 3 years, including only cities with population 5,000 and above)
| Robertsdale: | 38.7 |
| Foley: | 80.7 |
| Fairhope: | 26.4 |
| Daphne: | 35.3 |
| Spanish Fort: | 34.2 |
| Gulf Shores: | 69.9 |
| Orange Beach: | 61.0 |
| Bay Minette: | 70.7 |
| Mobile: | 15.4 |

 33.2% incidents where reported in the morning and 66.8% in the evening. The most fires (19.0%) took place on Tuesday, and the least (10.2%) on Monday.
 Based on the 205 fire incident reports from years 2008 - 2018 most fires (16.6%) took place during January, and the least (4.4%) in May.
 Out of all 750 cases reported during the years 2008 - 2018, the most belonged to the categories: Overpressure Rupture (34.9%), Fire (27.3%), and Service Call (20.0%).
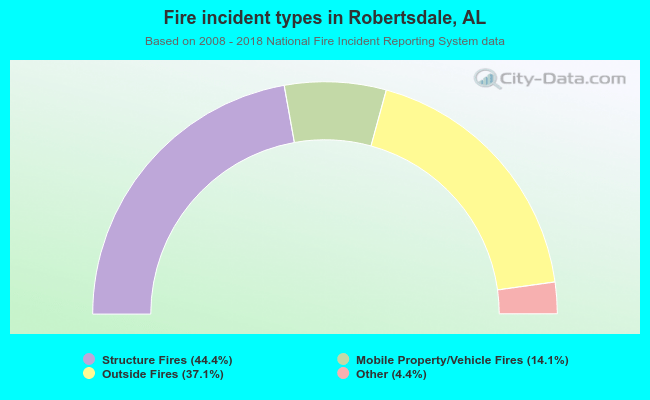 When looking into fire subcategories, the most incidents belonged to: Structure Fires (44.4%), and Outside Fires (37.1%).