Gardnerville: Fire Incidents, Nevada (NV)
Where are fire incidents reported in Gardnerville, NV
Something went wrong! Please refresh the page.
|
| |||||||||||||||||||||||||||||||||||||||||||||||||||||||||||||||||||||||||||||||||||||||||||||||||||||||||||||
| Other | 291 | |||||||||||||||||||||||||||||||||||||||||||||||||||||||||||||||||||||||||||||||||||||||||||||||||||||||||||||
2002 - 2018 National Fire Incident Reporting System (NFIRS) incidents
- Incident types reported to NFIRS in Gardnerville, NV
- 11,38574.9%Rescue & EMS
- 1,0456.9%Fire
- 8595.7%Good Intent Call
- 8405.5%Service Call
- 7084.7%Hazardous Condition
- 3482.3%False Alarm
- Fire incident types reported to NFIRS in Gardnerville, NV
- 58856.3%Outside Fires
- 32030.6%Structure Fires
- 1039.9%Mobile Property/Vehicle Fires
- 343.3%Other
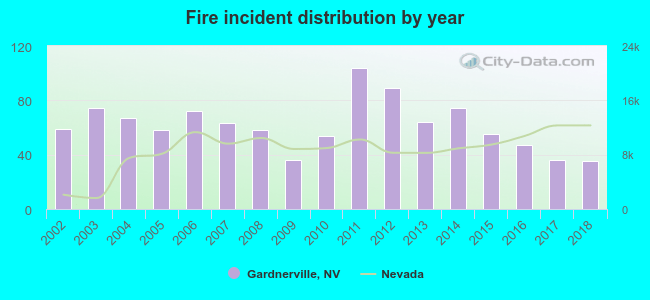 Based on the data from the years 2002 - 2018 the average number of fire incidents per year is 61. The highest number of fire incidents - 104 took place in 2011, and the least - 35 in 2018. The data has a dropping trend.
The average number of yearly fire incidents per 10k residents in Gardnerville, NV compared to nearest cities:
(Note: Based on data for the last 3 years, including only cities with population 5,000 and above)
| Gardnerville: | 69.5 |
| Gardnerville Ranchos: | 0.9 |
| Indian Hills: | 1.8 |
| Zephyr Cove: | 15.2 |
| Carson City: | 28.3 |
| Dayton: | 45.0 |
| Incline Village: | 20.3 |
| Washoe Valley: | 14.4 |
| Reno: | 41.0 |
 The median response time based on all reported fire incidents is 9 minutes. This is higher than the state median value.
The median response time in Gardnerville, NV compared to nearest cities:
(Note: Based on data for all years, including only cities with at least 500 fire incidents)
| Gardnerville: | 9 minutes |
| Carson City: | 6 minutes |
| Dayton: | 7 minutes |
| Virginia City: | 8 minutes |
| Yerington: | 9 minutes |
| Reno: | 7 minutes |
| Sparks: | 6 minutes |
| Fernley: | 9 minutes |
 29.7% incidents where reported in the morning and 70.3% in the evening. The most fires (16.3%) took place on Tuesday, and the least (12.8%) on Wednesday.
 According to the 1,045 fire incident reports from years 2002 - 2018 most fires (12.7%) took place during July, and the least (5.4%) in January.
 Out of all 15,200 cases reported during the years 2002 - 2018, the most belonged to the categories: Rescue & EMS (74.9%), Fire (6.9%), and Good Intent Call (5.7%).
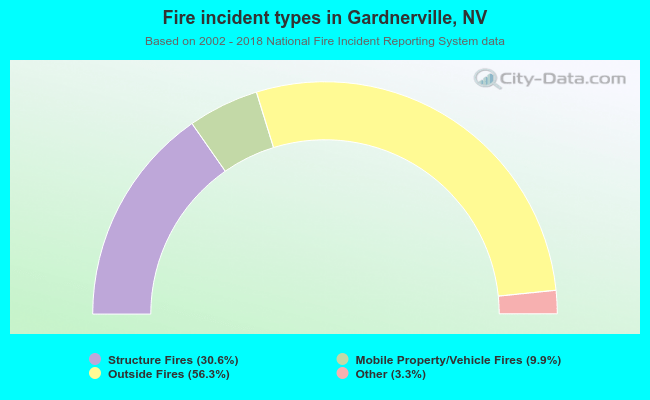 When looking into fire subcategories, the most incidents belonged to: Outside Fires (56.3%), and Structure Fires (30.6%).