Shirley, New York Submit your own pictures of this place and show them to the world
OSM Map
General Map
Google Map
MSN Map
OSM Map
General Map
Google Map
MSN Map
OSM Map
General Map
Google Map
MSN Map
OSM Map
General Map
Google Map
MSN Map
Please wait while loading the map...
Population in 2010: 27,854. Population change since 2000: +9.7%Males: 14,306 Females: 13,548
March 2022 cost of living index in Shirley: 149.0 (very high, U.S. average is 100) Percentage of residents living in poverty in 2022: 8.2%for White Non-Hispanic residents , 16.4% for Black residents , 9.6% for Hispanic or Latino residents , 14.9% for other race residents , 4.0% for two or more races residents )
Profiles of local businesses
Business Search - 14 Million verified businesses
Data:
Median household income ($)
Median household income (% change since 2000)
Household income diversity
Ratio of average income to average house value (%)
Ratio of average income to average rent
Median household income ($) - White
Median household income ($) - Black or African American
Median household income ($) - Asian
Median household income ($) - Hispanic or Latino
Median household income ($) - American Indian and Alaska Native
Median household income ($) - Multirace
Median household income ($) - Other Race
Median household income for houses/condos with a mortgage ($)
Median household income for apartments without a mortgage ($)
Races - White alone (%)
Races - White alone (% change since 2000)
Races - Black alone (%)
Races - Black alone (% change since 2000)
Races - American Indian alone (%)
Races - American Indian alone (% change since 2000)
Races - Asian alone (%)
Races - Asian alone (% change since 2000)
Races - Hispanic (%)
Races - Hispanic (% change since 2000)
Races - Native Hawaiian and Other Pacific Islander alone (%)
Races - Native Hawaiian and Other Pacific Islander alone (% change since 2000)
Races - Two or more races (%)
Races - Two or more races (% change since 2000)
Races - Other race alone (%)
Races - Other race alone (% change since 2000)
Racial diversity
Unemployment (%)
Unemployment (% change since 2000)
Unemployment (%) - White
Unemployment (%) - Black or African American
Unemployment (%) - Asian
Unemployment (%) - Hispanic or Latino
Unemployment (%) - American Indian and Alaska Native
Unemployment (%) - Multirace
Unemployment (%) - Other Race
Population density (people per square mile)
Population - Males (%)
Population - Females (%)
Population - Males (%) - White
Population - Males (%) - Black or African American
Population - Males (%) - Asian
Population - Males (%) - Hispanic or Latino
Population - Males (%) - American Indian and Alaska Native
Population - Males (%) - Multirace
Population - Males (%) - Other Race
Population - Females (%) - White
Population - Females (%) - Black or African American
Population - Females (%) - Asian
Population - Females (%) - Hispanic or Latino
Population - Females (%) - American Indian and Alaska Native
Population - Females (%) - Multirace
Population - Females (%) - Other Race
Coronavirus confirmed cases (May 21, 2024)
Deaths caused by coronavirus (May 21, 2024)
Coronavirus confirmed cases (per 100k population) (May 21, 2024)
Deaths caused by coronavirus (per 100k population) (May 21, 2024)
Daily increase in number of cases (May 21, 2024)
Weekly increase in number of cases (May 21, 2024)
Cases doubled (in days) (May 21, 2024)
Hospitalized patients (Apr 18, 2022)
Negative test results (Apr 18, 2022)
Total test results (Apr 18, 2022)
COVID Vaccine doses distributed (per 100k population) (Sep 19, 2023)
COVID Vaccine doses administered (per 100k population) (Sep 19, 2023)
COVID Vaccine doses distributed (Sep 19, 2023)
COVID Vaccine doses administered (Sep 19, 2023)
Likely homosexual households (%)
Likely homosexual households (% change since 2000)
Likely homosexual households - Lesbian couples (%)
Likely homosexual households - Lesbian couples (% change since 2000)
Likely homosexual households - Gay men (%)
Likely homosexual households - Gay men (% change since 2000)
Cost of living index
Median gross rent ($)
Median contract rent ($)
Median monthly housing costs ($)
Median house or condo value ($)
Median house or condo value ($ change since 2000)
Mean house or condo value by units in structure - 1, detached ($)
Mean house or condo value by units in structure - 1, attached ($)
Mean house or condo value by units in structure - 2 ($)
Mean house or condo value by units in structure by units in structure - 3 or 4 ($)
Mean house or condo value by units in structure - 5 or more ($)
Mean house or condo value by units in structure - Boat, RV, van, etc. ($)
Mean house or condo value by units in structure - Mobile home ($)
Median house or condo value ($) - White
Median house or condo value ($) - Black or African American
Median house or condo value ($) - Asian
Median house or condo value ($) - Hispanic or Latino
Median house or condo value ($) - American Indian and Alaska Native
Median house or condo value ($) - Multirace
Median house or condo value ($) - Other Race
Median resident age
Resident age diversity
Median resident age - Males
Median resident age - Females
Median resident age - White
Median resident age - Black or African American
Median resident age - Asian
Median resident age - Hispanic or Latino
Median resident age - American Indian and Alaska Native
Median resident age - Multirace
Median resident age - Other Race
Median resident age - Males - White
Median resident age - Males - Black or African American
Median resident age - Males - Asian
Median resident age - Males - Hispanic or Latino
Median resident age - Males - American Indian and Alaska Native
Median resident age - Males - Multirace
Median resident age - Males - Other Race
Median resident age - Females - White
Median resident age - Females - Black or African American
Median resident age - Females - Asian
Median resident age - Females - Hispanic or Latino
Median resident age - Females - American Indian and Alaska Native
Median resident age - Females - Multirace
Median resident age - Females - Other Race
Commute - mean travel time to work (minutes)
Travel time to work - Less than 5 minutes (%)
Travel time to work - Less than 5 minutes (% change since 2000)
Travel time to work - 5 to 9 minutes (%)
Travel time to work - 5 to 9 minutes (% change since 2000)
Travel time to work - 10 to 19 minutes (%)
Travel time to work - 10 to 19 minutes (% change since 2000)
Travel time to work - 20 to 29 minutes (%)
Travel time to work - 20 to 29 minutes (% change since 2000)
Travel time to work - 30 to 39 minutes (%)
Travel time to work - 30 to 39 minutes (% change since 2000)
Travel time to work - 40 to 59 minutes (%)
Travel time to work - 40 to 59 minutes (% change since 2000)
Travel time to work - 60 to 89 minutes (%)
Travel time to work - 60 to 89 minutes (% change since 2000)
Travel time to work - 90 or more minutes (%)
Travel time to work - 90 or more minutes (% change since 2000)
Marital status - Never married (%)
Marital status - Now married (%)
Marital status - Separated (%)
Marital status - Widowed (%)
Marital status - Divorced (%)
Median family income ($)
Median family income (% change since 2000)
Median non-family income ($)
Median non-family income (% change since 2000)
Median per capita income ($)
Median per capita income (% change since 2000)
Median family income ($) - White
Median family income ($) - Black or African American
Median family income ($) - Asian
Median family income ($) - Hispanic or Latino
Median family income ($) - American Indian and Alaska Native
Median family income ($) - Multirace
Median family income ($) - Other Race
Median year house/condo built
Median year apartment built
Year house built - Built 2005 or later (%)
Year house built - Built 2000 to 2004 (%)
Year house built - Built 1990 to 1999 (%)
Year house built - Built 1980 to 1989 (%)
Year house built - Built 1970 to 1979 (%)
Year house built - Built 1960 to 1969 (%)
Year house built - Built 1950 to 1959 (%)
Year house built - Built 1940 to 1949 (%)
Year house built - Built 1939 or earlier (%)
Average household size
Household density (households per square mile)
Average household size - White
Average household size - Black or African American
Average household size - Asian
Average household size - Hispanic or Latino
Average household size - American Indian and Alaska Native
Average household size - Multirace
Average household size - Other Race
Occupied housing units (%)
Vacant housing units (%)
Owner occupied housing units (%)
Renter occupied housing units (%)
Vacancy status - For rent (%)
Vacancy status - For sale only (%)
Vacancy status - Rented or sold, not occupied (%)
Vacancy status - For seasonal, recreational, or occasional use (%)
Vacancy status - For migrant workers (%)
Vacancy status - Other vacant (%)
Residents with income below the poverty level (%)
Residents with income below 50% of the poverty level (%)
Children below poverty level (%)
Poor families by family type - Married-couple family (%)
Poor families by family type - Male, no wife present (%)
Poor families by family type - Female, no husband present (%)
Poverty status for native-born residents (%)
Poverty status for foreign-born residents (%)
Poverty among high school graduates not in families (%)
Poverty among people who did not graduate high school not in families (%)
Residents with income below the poverty level (%) - White
Residents with income below the poverty level (%) - Black or African American
Residents with income below the poverty level (%) - Asian
Residents with income below the poverty level (%) - Hispanic or Latino
Residents with income below the poverty level (%) - American Indian and Alaska Native
Residents with income below the poverty level (%) - Multirace
Residents with income below the poverty level (%) - Other Race
Air pollution - Air Quality Index (AQI)
Air pollution - CO
Air pollution - NO2
Air pollution - SO2
Air pollution - Ozone
Air pollution - PM10
Air pollution - PM25
Air pollution - Pb
Crime - Murders per 100,000 population
Crime - Rapes per 100,000 population
Crime - Robberies per 100,000 population
Crime - Assaults per 100,000 population
Crime - Burglaries per 100,000 population
Crime - Thefts per 100,000 population
Crime - Auto thefts per 100,000 population
Crime - Arson per 100,000 population
Crime - City-data.com crime index
Crime - Violent crime index
Crime - Property crime index
Crime - Murders per 100,000 population (5 year average)
Crime - Rapes per 100,000 population (5 year average)
Crime - Robberies per 100,000 population (5 year average)
Crime - Assaults per 100,000 population (5 year average)
Crime - Burglaries per 100,000 population (5 year average)
Crime - Thefts per 100,000 population (5 year average)
Crime - Auto thefts per 100,000 population (5 year average)
Crime - Arson per 100,000 population (5 year average)
Crime - City-data.com crime index (5 year average)
Crime - Violent crime index (5 year average)
Crime - Property crime index (5 year average)
1996 Presidential Elections Results (%) - Democratic Party (Clinton)
1996 Presidential Elections Results (%) - Republican Party (Dole)
1996 Presidential Elections Results (%) - Other
2000 Presidential Elections Results (%) - Democratic Party (Gore)
2000 Presidential Elections Results (%) - Republican Party (Bush)
2000 Presidential Elections Results (%) - Other
2004 Presidential Elections Results (%) - Democratic Party (Kerry)
2004 Presidential Elections Results (%) - Republican Party (Bush)
2004 Presidential Elections Results (%) - Other
2008 Presidential Elections Results (%) - Democratic Party (Obama)
2008 Presidential Elections Results (%) - Republican Party (McCain)
2008 Presidential Elections Results (%) - Other
2012 Presidential Elections Results (%) - Democratic Party (Obama)
2012 Presidential Elections Results (%) - Republican Party (Romney)
2012 Presidential Elections Results (%) - Other
2016 Presidential Elections Results (%) - Democratic Party (Clinton)
2016 Presidential Elections Results (%) - Republican Party (Trump)
2016 Presidential Elections Results (%) - Other
2020 Presidential Elections Results (%) - Democratic Party (Biden)
2020 Presidential Elections Results (%) - Republican Party (Trump)
2020 Presidential Elections Results (%) - Other
Ancestries Reported - Arab (%)
Ancestries Reported - Czech (%)
Ancestries Reported - Danish (%)
Ancestries Reported - Dutch (%)
Ancestries Reported - English (%)
Ancestries Reported - French (%)
Ancestries Reported - French Canadian (%)
Ancestries Reported - German (%)
Ancestries Reported - Greek (%)
Ancestries Reported - Hungarian (%)
Ancestries Reported - Irish (%)
Ancestries Reported - Italian (%)
Ancestries Reported - Lithuanian (%)
Ancestries Reported - Norwegian (%)
Ancestries Reported - Polish (%)
Ancestries Reported - Portuguese (%)
Ancestries Reported - Russian (%)
Ancestries Reported - Scotch-Irish (%)
Ancestries Reported - Scottish (%)
Ancestries Reported - Slovak (%)
Ancestries Reported - Subsaharan African (%)
Ancestries Reported - Swedish (%)
Ancestries Reported - Swiss (%)
Ancestries Reported - Ukrainian (%)
Ancestries Reported - United States (%)
Ancestries Reported - Welsh (%)
Ancestries Reported - West Indian (%)
Ancestries Reported - Other (%)
Educational Attainment - No schooling completed (%)
Educational Attainment - Less than high school (%)
Educational Attainment - High school or equivalent (%)
Educational Attainment - Less than 1 year of college (%)
Educational Attainment - 1 or more years of college (%)
Educational Attainment - Associate degree (%)
Educational Attainment - Bachelor's degree (%)
Educational Attainment - Master's degree (%)
Educational Attainment - Professional school degree (%)
Educational Attainment - Doctorate degree (%)
School Enrollment - Nursery, preschool (%)
School Enrollment - Kindergarten (%)
School Enrollment - Grade 1 to 4 (%)
School Enrollment - Grade 5 to 8 (%)
School Enrollment - Grade 9 to 12 (%)
School Enrollment - College undergrad (%)
School Enrollment - Graduate or professional (%)
School Enrollment - Not enrolled in school (%)
School enrollment - Public schools (%)
School enrollment - Private schools (%)
School enrollment - Not enrolled (%)
Median number of rooms in houses and condos
Median number of rooms in apartments
Housing units lacking complete plumbing facilities (%)
Housing units lacking complete kitchen facilities (%)
Density of houses
Urban houses (%)
Rural houses (%)
Households with people 60 years and over (%)
Households with people 65 years and over (%)
Households with people 75 years and over (%)
Households with one or more nonrelatives (%)
Households with no nonrelatives (%)
Population in households (%)
Family households (%)
Nonfamily households (%)
Population in families (%)
Family households with own children (%)
Median number of bedrooms in owner occupied houses
Mean number of bedrooms in owner occupied houses
Median number of bedrooms in renter occupied houses
Mean number of bedrooms in renter occupied houses
Median number of vehichles in owner occupied houses
Mean number of vehichles in owner occupied houses
Median number of vehichles in renter occupied houses
Mean number of vehichles in renter occupied houses
Mortgage status - with mortgage (%)
Mortgage status - with second mortgage (%)
Mortgage status - with home equity loan (%)
Mortgage status - with both second mortgage and home equity loan (%)
Mortgage status - without a mortgage (%)
Average family size
Average family size - White
Average family size - Black or African American
Average family size - Asian
Average family size - Hispanic or Latino
Average family size - American Indian and Alaska Native
Average family size - Multirace
Average family size - Other Race
Geographical mobility - Same house 1 year ago (%)
Geographical mobility - Moved within same county (%)
Geographical mobility - Moved from different county within same state (%)
Geographical mobility - Moved from different state (%)
Geographical mobility - Moved from abroad (%)
Place of birth - Born in state of residence (%)
Place of birth - Born in other state (%)
Place of birth - Native, outside of US (%)
Place of birth - Foreign born (%)
Housing units in structures - 1, detached (%)
Housing units in structures - 1, attached (%)
Housing units in structures - 2 (%)
Housing units in structures - 3 or 4 (%)
Housing units in structures - 5 to 9 (%)
Housing units in structures - 10 to 19 (%)
Housing units in structures - 20 to 49 (%)
Housing units in structures - 50 or more (%)
Housing units in structures - Mobile home (%)
Housing units in structures - Boat, RV, van, etc. (%)
House/condo owner moved in on average (years ago)
Renter moved in on average (years ago)
Year householder moved into unit - Moved in 1999 to March 2000 (%)
Year householder moved into unit - Moved in 1995 to 1998 (%)
Year householder moved into unit - Moved in 1990 to 1994 (%)
Year householder moved into unit - Moved in 1980 to 1989 (%)
Year householder moved into unit - Moved in 1970 to 1979 (%)
Year householder moved into unit - Moved in 1969 or earlier (%)
Means of transportation to work - Drove car alone (%)
Means of transportation to work - Carpooled (%)
Means of transportation to work - Public transportation (%)
Means of transportation to work - Bus or trolley bus (%)
Means of transportation to work - Streetcar or trolley car (%)
Means of transportation to work - Subway or elevated (%)
Means of transportation to work - Railroad (%)
Means of transportation to work - Ferryboat (%)
Means of transportation to work - Taxicab (%)
Means of transportation to work - Motorcycle (%)
Means of transportation to work - Bicycle (%)
Means of transportation to work - Walked (%)
Means of transportation to work - Other means (%)
Working at home (%)
Industry diversity
Most Common Industries - Agriculture, forestry, fishing and hunting, and mining (%)
Most Common Industries - Agriculture, forestry, fishing and hunting (%)
Most Common Industries - Mining, quarrying, and oil and gas extraction (%)
Most Common Industries - Construction (%)
Most Common Industries - Manufacturing (%)
Most Common Industries - Wholesale trade (%)
Most Common Industries - Retail trade (%)
Most Common Industries - Transportation and warehousing, and utilities (%)
Most Common Industries - Transportation and warehousing (%)
Most Common Industries - Utilities (%)
Most Common Industries - Information (%)
Most Common Industries - Finance and insurance, and real estate and rental and leasing (%)
Most Common Industries - Finance and insurance (%)
Most Common Industries - Real estate and rental and leasing (%)
Most Common Industries - Professional, scientific, and management, and administrative and waste management services (%)
Most Common Industries - Professional, scientific, and technical services (%)
Most Common Industries - Management of companies and enterprises (%)
Most Common Industries - Administrative and support and waste management services (%)
Most Common Industries - Educational services, and health care and social assistance (%)
Most Common Industries - Educational services (%)
Most Common Industries - Health care and social assistance (%)
Most Common Industries - Arts, entertainment, and recreation, and accommodation and food services (%)
Most Common Industries - Arts, entertainment, and recreation (%)
Most Common Industries - Accommodation and food services (%)
Most Common Industries - Other services, except public administration (%)
Most Common Industries - Public administration (%)
Occupation diversity
Most Common Occupations - Management, business, science, and arts occupations (%)
Most Common Occupations - Management, business, and financial occupations (%)
Most Common Occupations - Management occupations (%)
Most Common Occupations - Business and financial operations occupations (%)
Most Common Occupations - Computer, engineering, and science occupations (%)
Most Common Occupations - Computer and mathematical occupations (%)
Most Common Occupations - Architecture and engineering occupations (%)
Most Common Occupations - Life, physical, and social science occupations (%)
Most Common Occupations - Education, legal, community service, arts, and media occupations (%)
Most Common Occupations - Community and social service occupations (%)
Most Common Occupations - Legal occupations (%)
Most Common Occupations - Education, training, and library occupations (%)
Most Common Occupations - Arts, design, entertainment, sports, and media occupations (%)
Most Common Occupations - Healthcare practitioners and technical occupations (%)
Most Common Occupations - Health diagnosing and treating practitioners and other technical occupations (%)
Most Common Occupations - Health technologists and technicians (%)
Most Common Occupations - Service occupations (%)
Most Common Occupations - Healthcare support occupations (%)
Most Common Occupations - Protective service occupations (%)
Most Common Occupations - Fire fighting and prevention, and other protective service workers including supervisors (%)
Most Common Occupations - Law enforcement workers including supervisors (%)
Most Common Occupations - Food preparation and serving related occupations (%)
Most Common Occupations - Building and grounds cleaning and maintenance occupations (%)
Most Common Occupations - Personal care and service occupations (%)
Most Common Occupations - Sales and office occupations (%)
Most Common Occupations - Sales and related occupations (%)
Most Common Occupations - Office and administrative support occupations (%)
Most Common Occupations - Natural resources, construction, and maintenance occupations (%)
Most Common Occupations - Farming, fishing, and forestry occupations (%)
Most Common Occupations - Construction and extraction occupations (%)
Most Common Occupations - Installation, maintenance, and repair occupations (%)
Most Common Occupations - Production, transportation, and material moving occupations (%)
Most Common Occupations - Production occupations (%)
Most Common Occupations - Transportation occupations (%)
Most Common Occupations - Material moving occupations (%)
People in Group quarters - Institutionalized population (%)
People in Group quarters - Correctional institutions (%)
People in Group quarters - Federal prisons and detention centers (%)
People in Group quarters - Halfway houses (%)
People in Group quarters - Local jails and other confinement facilities (including police lockups) (%)
People in Group quarters - Military disciplinary barracks (%)
People in Group quarters - State prisons (%)
People in Group quarters - Other types of correctional institutions (%)
People in Group quarters - Nursing homes (%)
People in Group quarters - Hospitals/wards, hospices, and schools for the handicapped (%)
People in Group quarters - Hospitals/wards and hospices for chronically ill (%)
People in Group quarters - Hospices or homes for chronically ill (%)
People in Group quarters - Military hospitals or wards for chronically ill (%)
People in Group quarters - Other hospitals or wards for chronically ill (%)
People in Group quarters - Hospitals or wards for drug/alcohol abuse (%)
People in Group quarters - Mental (Psychiatric) hospitals or wards (%)
People in Group quarters - Schools, hospitals, or wards for the mentally retarded (%)
People in Group quarters - Schools, hospitals, or wards for the physically handicapped (%)
People in Group quarters - Institutions for the deaf (%)
People in Group quarters - Institutions for the blind (%)
People in Group quarters - Orthopedic wards and institutions for the physically handicapped (%)
People in Group quarters - Wards in general hospitals for patients who have no usual home elsewhere (%)
People in Group quarters - Wards in military hospitals for patients who have no usual home elsewhere (%)
People in Group quarters - Juvenile institutions (%)
People in Group quarters - Long-term care (%)
People in Group quarters - Homes for abused, dependent, and neglected children (%)
People in Group quarters - Residential treatment centers for emotionally disturbed children (%)
People in Group quarters - Training schools for juvenile delinquents (%)
People in Group quarters - Short-term care, detention or diagnostic centers for delinquent children (%)
People in Group quarters - Type of juvenile institution unknown (%)
People in Group quarters - Noninstitutionalized population (%)
People in Group quarters - College dormitories (includes college quarters off campus) (%)
People in Group quarters - Military quarters (%)
People in Group quarters - On base (%)
People in Group quarters - Barracks, unaccompanied personnel housing (UPH), (Enlisted/Officer), ;and similar group living quarters for military personnel (%)
People in Group quarters - Transient quarters for temporary residents (%)
People in Group quarters - Military ships (%)
People in Group quarters - Group homes (%)
People in Group quarters - Homes or halfway houses for drug/alcohol abuse (%)
People in Group quarters - Homes for the mentally ill (%)
People in Group quarters - Homes for the mentally retarded (%)
People in Group quarters - Homes for the physically handicapped (%)
People in Group quarters - Other group homes (%)
People in Group quarters - Religious group quarters (%)
People in Group quarters - Dormitories (%)
People in Group quarters - Agriculture workers' dormitories on farms (%)
People in Group quarters - Job Corps and vocational training facilities (%)
People in Group quarters - Other workers' dormitories (%)
People in Group quarters - Crews of maritime vessels (%)
People in Group quarters - Other nonhousehold living situations (%)
People in Group quarters - Other noninstitutional group quarters (%)
Residents speaking English at home (%)
Residents speaking English at home - Born in the United States (%)
Residents speaking English at home - Native, born elsewhere (%)
Residents speaking English at home - Foreign born (%)
Residents speaking Spanish at home (%)
Residents speaking Spanish at home - Born in the United States (%)
Residents speaking Spanish at home - Native, born elsewhere (%)
Residents speaking Spanish at home - Foreign born (%)
Residents speaking other language at home (%)
Residents speaking other language at home - Born in the United States (%)
Residents speaking other language at home - Native, born elsewhere (%)
Residents speaking other language at home - Foreign born (%)
Class of Workers - Employee of private company (%)
Class of Workers - Self-employed in own incorporated business (%)
Class of Workers - Private not-for-profit wage and salary workers (%)
Class of Workers - Local government workers (%)
Class of Workers - State government workers (%)
Class of Workers - Federal government workers (%)
Class of Workers - Self-employed workers in own not incorporated business and Unpaid family workers (%)
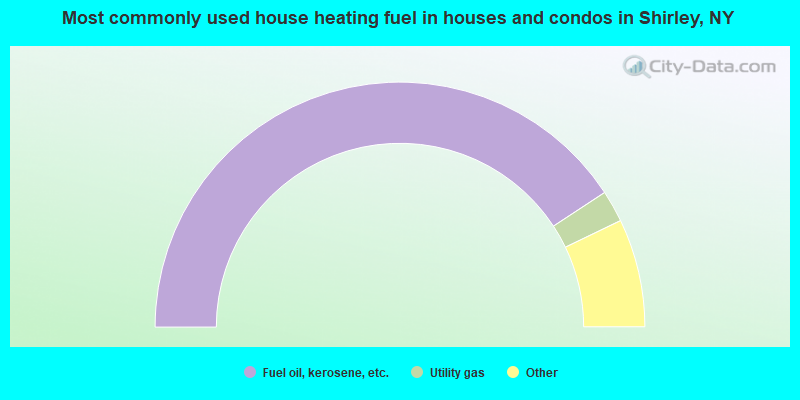
House heating fuel used in houses and condos - Utility gas (%)
House heating fuel used in houses and condos - Bottled, tank, or LP gas (%)
House heating fuel used in houses and condos - Electricity (%)
House heating fuel used in houses and condos - Fuel oil, kerosene, etc. (%)
House heating fuel used in houses and condos - Coal or coke (%)
House heating fuel used in houses and condos - Wood (%)
House heating fuel used in houses and condos - Solar energy (%)
House heating fuel used in houses and condos - Other fuel (%)
House heating fuel used in houses and condos - No fuel used (%)
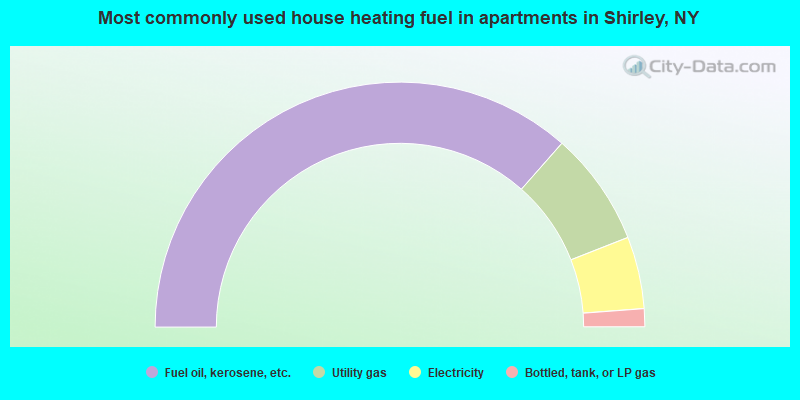
House heating fuel used in apartments - Utility gas (%)
House heating fuel used in apartments - Bottled, tank, or LP gas (%)
House heating fuel used in apartments - Electricity (%)
House heating fuel used in apartments - Fuel oil, kerosene, etc. (%)
House heating fuel used in apartments - Coal or coke (%)
House heating fuel used in apartments - Wood (%)
House heating fuel used in apartments - Solar energy (%)
House heating fuel used in apartments - Other fuel (%)
House heating fuel used in apartments - No fuel used (%)
Armed forces status - In Armed Forces (%)
Armed forces status - Civilian (%)
Armed forces status - Civilian - Veteran (%)
Armed forces status - Civilian - Nonveteran (%)
Fatal accidents locations in years 2005-2021
Fatal accidents locations in 2005
Fatal accidents locations in 2006
Fatal accidents locations in 2007
Fatal accidents locations in 2008
Fatal accidents locations in 2009
Fatal accidents locations in 2010
Fatal accidents locations in 2011
Fatal accidents locations in 2012
Fatal accidents locations in 2013
Fatal accidents locations in 2014
Fatal accidents locations in 2015
Fatal accidents locations in 2016
Fatal accidents locations in 2017
Fatal accidents locations in 2018
Fatal accidents locations in 2019
Fatal accidents locations in 2020
Fatal accidents locations in 2021
Alcohol use - People drinking some alcohol every month (%)
Alcohol use - People not drinking at all (%)
Alcohol use - Average days/month drinking alcohol
Alcohol use - Average drinks/week
Alcohol use - Average days/year people drink much
Audiometry - Average condition of hearing (%)
Audiometry - People that can hear a whisper from across a quiet room (%)
Audiometry - People that can hear normal voice from across a quiet room (%)
Audiometry - Ears ringing, roaring, buzzing (%)
Audiometry - Had a job exposure to loud noise (%)
Audiometry - Had off-work exposure to loud noise (%)
Blood Pressure & Cholesterol - Has high blood pressure (%)
Blood Pressure & Cholesterol - Checking blood pressure at home (%)
Blood Pressure & Cholesterol - Frequently checking blood cholesterol (%)
Blood Pressure & Cholesterol - Has high cholesterol level (%)
Consumer Behavior - Money monthly spent on food at supermarket/grocery store
Consumer Behavior - Money monthly spent on food at other stores
Consumer Behavior - Money monthly spent on eating out
Consumer Behavior - Money monthly spent on carryout/delivered foods
Consumer Behavior - Income spent on food at supermarket/grocery store (%)
Consumer Behavior - Income spent on food at other stores (%)
Consumer Behavior - Income spent on eating out (%)
Consumer Behavior - Income spent on carryout/delivered foods (%)
Current Health Status - General health condition (%)
Current Health Status - Blood donors (%)
Current Health Status - Has blood ever tested for HIV virus (%)
Current Health Status - Left-handed people (%)
Dermatology - People using sunscreen (%)
Diabetes - Diabetics (%)
Diabetes - Had a blood test for high blood sugar (%)
Diabetes - People taking insulin (%)
Diet Behavior & Nutrition - Diet health (%)
Diet Behavior & Nutrition - Milk product consumption (# of products/month)
Diet Behavior & Nutrition - Meals not home prepared (#/week)
Diet Behavior & Nutrition - Meals from fast food or pizza place (#/week)
Diet Behavior & Nutrition - Ready-to-eat foods (#/month)
Diet Behavior & Nutrition - Frozen meals/pizza (#/month)
Drug Use - People that ever used marijuana or hashish (%)
Drug Use - Ever used hard drugs (%)
Drug Use - Ever used any form of cocaine (%)
Drug Use - Ever used heroin (%)
Drug Use - Ever used methamphetamine (%)
Health Insurance - People covered by health insurance (%)
Kidney Conditions-Urology - Avg. # of times urinating at night
Medical Conditions - People with asthma (%)
Medical Conditions - People with anemia (%)
Medical Conditions - People with psoriasis (%)
Medical Conditions - People with overweight (%)
Medical Conditions - Elderly people having difficulties in thinking or remembering (%)
Medical Conditions - People who ever received blood transfusion (%)
Medical Conditions - People having trouble seeing even with glass/contacts (%)
Medical Conditions - People with arthritis (%)
Medical Conditions - People with gout (%)
Medical Conditions - People with congestive heart failure (%)
Medical Conditions - People with coronary heart disease (%)
Medical Conditions - People with angina pectoris (%)
Medical Conditions - People who ever had heart attack (%)
Medical Conditions - People who ever had stroke (%)
Medical Conditions - People with emphysema (%)
Medical Conditions - People with thyroid problem (%)
Medical Conditions - People with chronic bronchitis (%)
Medical Conditions - People with any liver condition (%)
Medical Conditions - People who ever had cancer or malignancy (%)
Mental Health - People who have little interest in doing things (%)
Mental Health - People feeling down, depressed, or hopeless (%)
Mental Health - People who have trouble sleeping or sleeping too much (%)
Mental Health - People feeling tired or having little energy (%)
Mental Health - People with poor appetite or overeating (%)
Mental Health - People feeling bad about themself (%)
Mental Health - People who have trouble concentrating on things (%)
Mental Health - People moving or speaking slowly or too fast (%)
Mental Health - People having thoughts they would be better off dead (%)
Oral Health - Average years since last visit a dentist
Oral Health - People embarrassed because of mouth (%)
Oral Health - People with gum disease (%)
Oral Health - General health of teeth and gums (%)
Oral Health - Average days a week using dental floss/device
Oral Health - Average days a week using mouthwash for dental problem
Oral Health - Average number of teeth
Pesticide Use - Households using pesticides to control insects (%)
Pesticide Use - Households using pesticides to kill weeds (%)
Physical Activity - People doing vigorous-intensity work activities (%)
Physical Activity - People doing moderate-intensity work activities (%)
Physical Activity - People walking or bicycling (%)
Physical Activity - People doing vigorous-intensity recreational activities (%)
Physical Activity - People doing moderate-intensity recreational activities (%)
Physical Activity - Average hours a day doing sedentary activities
Physical Activity - Average hours a day watching TV or videos
Physical Activity - Average hours a day using computer
Physical Functioning - People having limitations keeping them from working (%)
Physical Functioning - People limited in amount of work they can do (%)
Physical Functioning - People that need special equipment to walk (%)
Physical Functioning - People experiencing confusion/memory problems (%)
Physical Functioning - People requiring special healthcare equipment (%)
Prescription Medications - Average number of prescription medicines taking
Preventive Aspirin Use - Adults 40+ taking low-dose aspirin (%)
Reproductive Health - Vaginal deliveries (%)
Reproductive Health - Cesarean deliveries (%)
Reproductive Health - Deliveries resulted in a live birth (%)
Reproductive Health - Pregnancies resulted in a delivery (%)
Reproductive Health - Women breastfeeding newborns (%)
Reproductive Health - Women that had a hysterectomy (%)
Reproductive Health - Women that had both ovaries removed (%)
Reproductive Health - Women that have ever taken birth control pills (%)
Reproductive Health - Women taking birth control pills (%)
Reproductive Health - Women that have ever used Depo-Provera or injectables (%)
Reproductive Health - Women that have ever used female hormones (%)
Sexual Behavior - People 18+ that ever had sex (vaginal, anal, or oral) (%)
Sexual Behavior - Males 18+ that ever had vaginal sex with a woman (%)
Sexual Behavior - Males 18+ that ever performed oral sex on a woman (%)
Sexual Behavior - Males 18+ that ever had anal sex with a woman (%)
Sexual Behavior - Males 18+ that ever had any sex with a man (%)
Sexual Behavior - Females 18+ that ever had vaginal sex with a man (%)
Sexual Behavior - Females 18+ that ever performed oral sex on a man (%)
Sexual Behavior - Females 18+ that ever had anal sex with a man (%)
Sexual Behavior - Females 18+ that ever had any kind of sex with a woman (%)
Sexual Behavior - Average age people first had sex
Sexual Behavior - Average number of female sex partners in lifetime (males 18+)
Sexual Behavior - Average number of female vaginal sex partners in lifetime (males 18+)
Sexual Behavior - Average age people first performed oral sex on a woman (18+)
Sexual Behavior - Average number of woman performed oral sex on in lifetime (18+)
Sexual Behavior - Average number of male sex partners in lifetime (males 18+)
Sexual Behavior - Average number of male anal sex partners in lifetime (males 18+)
Sexual Behavior - Average age people first performed oral sex on a man (18+)
Sexual Behavior - Average number of male oral sex partners in lifetime (18+)
Sexual Behavior - People using protection when performing oral sex (%)
Sexual Behavior - Average number of times people have vaginal or anal sex a year
Sexual Behavior - People having sex without condom (%)
Sexual Behavior - Average number of male sex partners in lifetime (females 18+)
Sexual Behavior - Average number of male vaginal sex partners in lifetime (females 18+)
Sexual Behavior - Average number of female sex partners in lifetime (females 18+)
Sexual Behavior - Circumcised males 18+ (%)
Sleep Disorders - Average hours sleeping at night
Sleep Disorders - People that has trouble sleeping (%)
Smoking-Cigarette Use - People smoking cigarettes (%)
Taste & Smell - People 40+ having problems with smell (%)
Taste & Smell - People 40+ having problems with taste (%)
Taste & Smell - People 40+ that ever had wisdom teeth removed (%)
Taste & Smell - People 40+ that ever had tonsils teeth removed (%)
Taste & Smell - People 40+ that ever had a loss of consciousness because of a head injury (%)
Taste & Smell - People 40+ that ever had a broken nose or other serious injury to face or skull (%)
Taste & Smell - People 40+ that ever had two or more sinus infections (%)
Weight - Average height (inches)
Weight - Average weight (pounds)
Weight - Average BMI
Weight - People that are obese (%)
Weight - People that ever were obese (%)
Weight - People trying to lose weight (%)
Latest news from Shirley, NY collected exclusively by city-data.com from local newspapers, TV, and radio stations
Ancestries: Italian (22.9%), Irish (9.7%), American (6.7%), German (4.6%), Polish (2.8%), Greek (1.1%).
Current Local Time:
Land area: 11.1 square miles.
Population density: 2,503 people per square mile (average).
3,206 residents are foreign born (7.2% Latin America , 3.4% Asia , 1.3% Europe ).
This place:
12.1%New York:
22.6%
Median real estate property taxes paid for housing units with mortgages in 2022: $9,279 (2.3%)Median real estate property taxes paid for housing units with no mortgage in 2022: $8,219 (2.2%)
Nearest city with pop. 50,000+: Brentwood, NY
Nearest city with pop. 200,000+: North Hempstead, NY
Nearest city with pop. 1,000,000+: Queens, NY
Nearest cities:
Latitude: 40.80 N, Longitude: 72.87 W
Daytime population change due to commuting: -5,622 (-21.2%)Workers who live and work in this place: 2,634 (20.7%)
Area code commonly used in this area: 631
Unemployment in December 2023:
Most common occupations in Shirley, NY (%)
Both Males Females
Other office and administrative support workers, including supervisors (4.9%)
Building and grounds cleaning and maintenance occupations (4.5%)
Material recording, scheduling, dispatching, and distributing workers (4.1%)
Cashiers (3.9%)
Retail sales workers, except cashiers (3.8%)
Other production occupations, including supervisors (3.6%)
Other sales and related occupations, including supervisors (3.4%)
Building and grounds cleaning and maintenance occupations (6.2%)
Driver/sales workers and truck drivers (5.1%)
Electrical equipment mechanics and other installation, maintenance, and repair workers, including supervisors (5.0%)
Material recording, scheduling, dispatching, and distributing workers (5.0%)
Other management occupations, except farmers and farm managers (4.2%)
Vehicle and mobile equipment mechanics, installers, and repairers (4.0%)
Carpenters (4.0%)
Other office and administrative support workers, including supervisors (7.0%)
Cashiers (6.3%)
Retail sales workers, except cashiers (5.1%)
Secretaries and administrative assistants (4.9%)
Nursing, psychiatric, and home health aides (4.3%)
Other production occupations, including supervisors (3.8%)
Information and record clerks, except customer service representatives (3.8%)
Tornado activity:
Shirley-area historical tornado activity is near New York state average. It is 65% smaller than the overall U.S. average.
On 7/10/1989, a category F4 (max. wind speeds 207-260 mph) tornado 36.3 miles away from the Shirley place center injured 40 people and caused between $50,000,000 and $500,000,000 in damages.
On 7/10/1989, a category F2 (max. wind speeds 113-157 mph) tornado 5.0 miles away from the place center injured one person .
Earthquake activity:
Shirley-area historical earthquake activity is significantly above New York state average. It is 72% smaller than the overall U.S. average. On 10/7/1983 at 10:18:46, a magnitude 5.3 (5.1 MB, 5.3 LG, 5.1 ML, Class: Moderate, Intensity: VI - VII) earthquake occurred 230.9 miles away from Shirley center On 8/23/2011 at 17:51:04, a magnitude 5.8 (5.8 MW, Depth: 3.7 mi) earthquake occurred 336.5 miles away from Shirley center On 4/20/2002 at 10:50:47, a magnitude 5.3 (5.3 ML, Depth: 3.0 mi) earthquake occurred 260.4 miles away from the city center On 8/22/1992 at 12:20:32, a magnitude 4.8 (4.8 MB, 3.8 MS, 4.7 LG, Depth: 6.2 mi, Class: Light, Intensity: IV - V) earthquake occurred 178.8 miles away from the city center On 4/20/2002 at 10:50:47, a magnitude 5.2 (5.2 MB, 4.2 MS, 5.2 MW, 5.0 MW) earthquake occurred 258.8 miles away from the city center On 1/16/1994 at 01:49:16, a magnitude 4.6 (4.6 MB, 4.6 LG, Depth: 3.1 mi) earthquake occurred 169.5 miles away from the city center Magnitude types: regional Lg-wave magnitude (LG), body-wave magnitude (MB), local magnitude (ML), surface-wave magnitude (MS), moment magnitude (MW) Natural disasters: The number of natural disasters in Suffolk County (28) is a lot greater than the US average (15).Major Disasters (Presidential) Declared: 19Emergencies Declared: 7Hurricanes: 9, Floods: 7, Storms: 7, Snowstorms: 4, Winter Storms: 3, Blizzards: 2, Heavy Rain: 1, Power Outage: 1, Tropical Depression: 1, Tropical Storm: 1, Water Shortage: 1, Other: 3 (Note: some incidents may be assigned to more than one category). Hospitals and medical centers in Shirley: FREE, INC (22 MAPLEWOOD DR) Other hospitals and medical centers near Shirley: FREE, INC (Hospital, about 2 miles away; MASTIC, NY)
FREE, INC (Hospital, about 3 miles away; MASTIC, NY)
FREE, INC (Hospital, about 3 miles away; MASTIC BEACH, NY)
JOHN J FOLEY SKILLED NURSING FACILITY (Nursing Home, about 3 miles away; YAPHANK, NY)
INDEPENDENT GROUP HOME LIVING PROGRAM, INC (Hospital, about 4 miles away; MANORVILLE, NY)
BELLHAVEN NURSING AND REHAB CENTER (Nursing Home, about 4 miles away; BROOKHAVEN, NY)
INDEPENDENT GROUP HOME LIVING PROGRAM, INC (Hospital, about 6 miles away; CENTER MORICHES, NY)
Airports located in Shirley: Colleges/universities with over 2000 students nearest to Shirley:
Suffolk County Community College (about 11 miles; Selden, NY ; Full-time enrollment: 18,540)
Stony Brook University (about 16 miles; Stony Brook, NY ; FT enrollment: 22,071)
Dowling College (about 16 miles; Oakdale, NY ; FT enrollment: 2,598)
Farmingdale State College (about 30 miles; Farmingdale, NY ; FT enrollment: 6,956)
Porter and Chester Institute of Stratford (about 30 miles; Stratford, CT ; FT enrollment: 2,822)
University of Bridgeport (about 31 miles; Bridgeport, CT ; FT enrollment: 3,708)
Housatonic Community College (about 32 miles; Bridgeport, CT ; FT enrollment: 3,677)
Public elementary/middle schools in Shirley:
See full list of schools located in Shirley Library in Shirley: MASTICS-MORICHES-SHIRLEY COMMUNITY LIB Operating income: $8,505,937; Location: 407 WILLIAM FLOYD PARKWAY; 218,134 books ; 5,081 e-books ; 14,236 audio materials ; 26,914 video materials ; 77 local licensed databases ; 14 state licensed databases ; 1,717 print serial subscriptions )
User-submitted facts and corrections:
My favorite radio station 92.9/ WEHM is not listed.... Just thought you'd like to know it comes in pretty strong here as well. added by LINYSoxFan
Church in Shirley: St. John the Theologian Orthodox Church, 158 West End Avenue. 631-587-9460
Suffolk County has a predicted average indoor radon screening level less than 2 pCi/L (pico curies per liter) - Low Potential Drinking water stations with addresses in Shirley and their reported violations in the past:
OLD STOVE PUB (Population served: 150, Groundwater):
Past monitoring violations:
One routine major monitoring violation
Population served: 75, Groundwater):
Past monitoring violations:
One regular monitoring violation
Drinking water stations with addresses in Shirley that have no violations reported:
HERO HAVEN AND MORE (Population served: 300, Primary Water Source Type: Groundwater)
Average household size: This place:
3.3 peopleNew York:
2.6 people
Percentage of family households: This place:
81.8%Whole state:
63.5%
Percentage of households with unmarried partners: This place:
8.4%Whole state:
6.8%
Likely homosexual households (counted as self-reported same-sex unmarried-partner households)
Lesbian couples: 0.6% of all households Gay men: 0.4% of all households
People in group quarters in Shirley in 2010:
234 people in college/university student housing
22 people in group homes intended for adults
15 people in emergency and transitional shelters (with sleeping facilities) for people experiencing homelessness
9 people in residential treatment centers for adults
People in group quarters in Shirley in 2000:
98 people in college dormitories (includes college quarters off campus)
26 people in homes or halfway houses for drug/alcohol abuse
25 people in homes for the mentally retarded
20 people in other noninstitutional group quarters
6 people in homes for the mentally ill
Banks with most branches in Shirley (2011 data):
JPMorgan Chase Bank, National Association: Shirley South Port Center Branch at 645 William Floyd Pkwy, branch established on 2010/12/16; Shirley Branch at 425 William Floyd Parkway, branch established on 1934/01/01. Info updated 2011/11/10: Bank assets: $1,811,678.0 mil, Deposits: $1,190,738.0 mil, headquarters in Columbus, OH, positive income , International Specialization, 5577 total offices , Holding Company: Jpmorgan Chase & Co.
The Bridgehampton National Bank: Shirley Branch at 630 Montauk Hwy., branch established on 2009/04/22. Info updated 2011/06/09: Bank assets: $1,333.4 mil, Deposits: $1,201.2 mil, headquarters in Bridgehampton, NY, positive income , Commercial Lending Specialization, 20 total offices , Holding Company: Bridge Bancorp, Inc.
New York Commercial Bank: Shirley Branch at 950 Montauk Highway, branch established on 1998/09/01. Info updated 2010/12/14: Bank assets: $2,585.3 mil, Deposits: $1,896.7 mil, headquarters in Westbury, NY, positive income , Commercial Lending Specialization, 34 total offices , Holding Company: New York Community Bancorp, Inc.
Bank of America, National Association: Shirley Branch at 1017 Montauk Highway, branch established on 1973/03/29. Info updated 2009/11/18: Bank assets: $1,451,969.3 mil, Deposits: $1,077,176.8 mil, headquarters in Charlotte, NC, positive income , 5782 total offices , Holding Company: Bank Of America Corporation
Empire National Bank: Shirley Branch at 1044 William Floyd Parkway, branch established on 2008/04/04. Info updated 2008/06/16: Bank assets: $339.7 mil, Deposits: $265.0 mil, headquarters in Islandia, NY, positive income , Commercial Lending Specialization, 3 total offices
New York Community Bank: Shirley Branch at 800 Montauk Highway, branch established on 1997/05/03. Info updated 2010/03/29: Bank assets: $39,468.7 mil, Deposits: $20,709.8 mil, headquarters in Westbury, NY, positive income , Commercial Lending Specialization, 247 total offices , Holding Company: New York Community Bancorp, Inc.
TD Bank, National Association: Shirley Branch at 530 William Floyd Parkway, branch established on 2007/09/29. Info updated 2010/10/04: Bank assets: $188,912.6 mil, Deposits: $153,149.8 mil, headquarters in Wilmington, DE, positive income , 1314 total offices , Holding Company: Toronto-Dominion Bank, The
Astoria Federal Savings and Loan Association: Montauk Branch at 999 Montauk Highway, Unit 25, branch established on 1923/01/01. Info updated 2011/07/21: Bank assets: $16,975.1 mil, Deposits: $11,426.8 mil, headquarters in Long Island City, NY, positive income , Mortgage Lending Specialization, 86 total offices
Capital One, National Association: Shirley Branch at 800 Montauk Hwy., branch established on 1981/09/28. Info updated 2011/07/01: Bank assets: $133,477.8 mil, Deposits: $97,063.7 mil, headquarters in Mclean, VA, positive income , 984 total offices , Holding Company: Capital One Financial Corporation
For population 15 years and over in Shirley:
Never married: 36.1%Now married: 46.3%Separated: 1.5%Widowed: 5.9%Divorced: 10.2% For population 25 years and over in Shirley:
High school or higher: 89.4%Bachelor's degree or higher: 19.5%Graduate or professional degree: 6.9%Unemployed: 5.8%Mean travel time to work (commute): 31.3 minutes
Education Gini index (Inequality in education) Here:
11.5New York average:
13.9
Religion statistics for Shirley, NY (based on Suffolk County data)
Religion Adherents Congregations Catholic 879,457 75 Mainline Protestant 69,205 182 Evangelical Protestant 58,909 264 Other 50,771 124 Orthodox 10,190 10 Black Protestant 8,298 49 None 416,520 -
Source: Clifford Grammich, Kirk Hadaway, Richard Houseal, Dale E.Jones, Alexei Krindatch, Richie Stanley and Richard H.Taylor. 2012. 2010 U.S.Religion Census: Religious Congregations & Membership Study. Association of Statisticians of American Religious Bodies. Jones, Dale E., et al. 2002. Congregations and Membership in the United States 2000. Nashville, TN: Glenmary Research Center. Graphs represent county-level data
Food Environment Statistics: Number of grocery stores : 514This county :
3.40 / 10,000 pop.New York :
4.13 / 10,000 pop.
Number of supercenters and club stores : 9Suffolk County :
0.06 / 10,000 pop.New York :
0.06 / 10,000 pop.
Number of convenience stores (no gas) : 217Suffolk County :
1.44 / 10,000 pop.New York :
0.92 / 10,000 pop.
Number of convenience stores (with gas) : 256This county :
1.69 / 10,000 pop.State :
1.68 / 10,000 pop.
Number of full-service restaurants : 1,232Suffolk County :
8.15 / 10,000 pop.State :
8.82 / 10,000 pop.
Adult obesity rate : Suffolk County :
23.4%New York :
23.8%
Low-income preschool obesity rate : Health and Nutrition:
Average overall health of teeth and gums : This city:
43.5%New York:
48.1%
People feeling badly about themselves : This city:
22.9%New York:
20.3%
People not drinking alcohol at all : Shirley:
10.0%New York:
11.1%
Average hours sleeping at night : Overweight people : This city:
33.2%State:
33.4%
General health condition : Average condition of hearing : This city:
79.5%New York:
80.2%
More about Health and Nutrition of Shirley, NY Residents
4.14% of this county's 2021 resident taxpayers lived in other counties in 2020 ($206,656 average adjusted gross income )
Here:
4.14%New York average:
5.29%
0.01% of residents moved from foreign countries ($74 average AGI )Suffolk County:
0.01%New York average:
0.01%
Top counties from which taxpayers relocated into this county between 2020 and 2021:
4.28% of this county's 2020 resident taxpayers moved to other counties in 2021 ($141,172 average adjusted gross income )
Here:
4.28%New York average:
6.93%
0.01% of residents moved to foreign countries ($169 average AGI )Suffolk County:
0.01%New York average:
0.02%
Top counties to which taxpayers relocated from this county between 2020 and 2021:
Businesses in Shirley, NY
Name Count Name Count
7-Eleven 2 Lane Bryant 1 AMF Bowling 1 Marshalls 1 AT&T 1 McDonald's 1 Advance Auto Parts 1 Nike 2 Applebee's 1 Pathmark 1 Baskin-Robbins 2 Payless 1 Bath & Body Works 1 RadioShack 2 Blockbuster 1 Rite Aid 2 Burger King 1 Sears 1 CVS 2 Sprint Nextel 1 Dunkin Donuts 2 Staples 1 Famous Footwear 1 Stop & Shop 1 FedEx 1 Subway 1 GNC 2 T-Mobile 2 GameStop 2 Taco Bell 1 H&R Block 1 Toys"R"Us 1 Home Depot 1 U-Haul 1 Justice 1 UPS 2 KFC 1 Wendy's 1 Kohl's 1
Strongest AM radio stations in Shirley:
WLIM (1580 AM; 10 kW; PATCHOGUE, NY; Owner: POLNET COMMUNICATIONS, LTD.)
WGSM (740 AM; 25 kW; HUNTINGTON, NY; Owner: K RADIO LICENSEE, INC.)
WFAN (660 AM; 50 kW; NEW YORK, NY; Owner: INFINITY BROADCASTING OPERATIONS, INC.)
WCBS (880 AM; 50 kW; NEW YORK, NY; Owner: INFINITY BROADCASTING OPERATIONS, INC.)
WMCA (570 AM; 50 kW; NEW YORK, NY; Owner: SALEM MEDIA OF NEW YORK, LLC)
WOR (710 AM; 50 kW; NEW YORK, NY; Owner: BUCKLEY BROADCASTING CORPORATION)
WABC (770 AM; 50 kW; NEW YORK, NY; Owner: WABC-AM RADIO, INC.)
WLIE (540 AM; 2 kW; ISLIP, NY; Owner: LONG ISLAND MULTIMEDIA, LLC.)
WEPN (1050 AM; 50 kW; NEW YORK, NY; Owner: NEW YORK AM RADIO, LLC)
WBBR (1130 AM; 50 kW; NEW YORK, NY; Owner: BLOOMBERG COMMUNICATIONS INC.)
WINS (1010 AM; 50 kW; NEW YORK, NY; Owner: INFINITY BROADCASTING OPERATIONS, INC.)
WQEW (1560 AM; 50 kW; NEW YORK, NY; Owner: THE NEW YORK TIMES ELECTRONIC MEDIA COMPANY)
WTIC (1080 AM; 50 kW; HARTFORD, CT; Owner: INFINITY RADIO OPERATIONS INC.)
Strongest FM radio stations in Shirley:
WLIU (88.3 FM; SOUTHAMPTON, NY; Owner: LONG ISLAND UNIVERSITY PUBLIC RADIO NETWORK)
WALK-FM (97.5 FM; PATCHOGUE, NY; Owner: AMFM RADIO LICENSES, L.L.C.)
WXXP (105.3 FM; CALVERTON-ROANOKE, NY; Owner: JARAD BROADCASTING CO. OF CALVERTON, INC)
WRCN-FM (103.9 FM; RIVERHEAD, NY; Owner: IW LIMITED LIABILITY COMPANY)
WBLI (106.1 FM; PATCHOGUE, NY; Owner: CXR HOLDINGS, INC.)
WUSB (90.1 FM; STONY BROOK, NY; Owner: STATE UNIVERSITY OF NEW YORK)
WDRE (98.5 FM; WESTHAMPTON, NY; Owner: JARAD BROADCATING COMPANY OF WESTHAMPTON, INC.)
W289AD (105.7 FM; SELDEN, NY; Owner: SACRED HEART UNIVERSITY, INC.)
WLVG (96.1 FM; CENTER MORICHES, NY; Owner: WAY BROADCASTING, INC.)
WFRS (88.9 FM; SMITHTOWN, NY; Owner: FAMILY STATIONS, INC.)
WBZO (103.1 FM; BAY SHORE, NY; Owner: MID-ISLAND BROADCASTING LIMITED PARTNERSHIP)
WMJC (94.3 FM; SMITHTOWN, NY; Owner: IW LIMITED LIABILITY COMPANY)
WKCI-FM (101.3 FM; HAMDEN, CT; Owner: CLEAR CHANNEL BROADCASTING LICENSES, INC.)
WBON (107.1 FM; HAMPTON BAYS, NY; Owner: NASSAU BROADCASTING HOLDINGS, INC.)
WSHR (91.9 FM; LAKE RONKONKOMA, NY; Owner: SACHEM CENTRAL SCH DIST HOLBROOK)
WPLR (99.1 FM; NEW HAVEN, CT; Owner: COX RADIO, INC.)
W217AF (91.3 FM; HUNTINGTON STATION, NY; Owner: SACRED HEART UNIVERSITY, INC.)
WBAZ (102.5 FM; BRIDGEHAMPTON, NY; Owner: AAA ENTERTAINMENT LICENSING LLC)
W219BA (91.7 FM; RIDGE, NY; Owner: SACRED HEART UNIVERSITY, INC.)
TV broadcast stations around Shirley:
WLNY (Channel 55; RIVERHEAD, NY; Owner: WLNY-TV, INC.)
WFTY (Channel 67; SMITHTOWN, NY; Owner: UNIVISION NEW YORK LLC)
W26CE (Channel 26; NEW YORK, NY; Owner: ATLANTIC COAST COMMUNICATIONS, INC.)
National Bridge Inventory (NBI) Statistics 7 Number of bridges79ft / 24.2m Total length $28,776,000 Total costs147,250 Total average daily traffic5,478 Total average daily truck traffic
FCC Registered Antenna Towers: 54 (
See the full list of FCC Registered Antenna Towers in Shirley )
FCC Registered Broadcast Land Mobile Towers: 7
100 Ft W Of Wm Floyd Pky & Dune Rd (Lat: 40.730667 Lon: -72.872333), Call Sign: KNGZ793, Assigned Frequencies: 155.760 MHz, Grant Date: 05/07/1998, Expiration Date: 07/20/2003, Cancellation Date: 09/21/2003, Registrant: County Of Suffolk, West Sayville, NY 11796 Corner Mcgraw St & Montauk Hwy (Lat: 40.802611 Lon: -72.872889), Call Sign: WSL760, Licensee ID: L00048023, Assigned Frequencies: 155.280 MHz, Grant Date: 08/23/1999, Expiration Date: 09/29/2004, Cancellation Date: 12/04/2004, Registrant: Shirley Community Ambulance Corp, Shirley, NY 11967, Phone: (516) 399-5380 1300 William Floyd Parkway (Lat: 40.825417 Lon: -72.872444), Type: Bant, Structure height: 11.8 m, Overall height: 16.4 m, Call Sign: WPWF820, Assigned Frequencies: 5350.00 MHz, Grant Date: 08/22/2012, Expiration Date: 11/06/2022, Cancellation Date: 09/13/2013, Certifier: Patrick Dolan, Registrant: Mintz, Levin, Cohn, Ferris, Glovsky And Popeo, P.C., 701 Pennsylvania Avenue N.W., Suite 900, Washington, DC 20004, Phone: (202) 434-7483, Fax: (202) 434-7400, Email:
1300 William Floyd Parkway (Lat: 40.825417 Lon: -72.872444), Type: Bant, Structure height: 11.8 m, Overall height: 16.4 m, Call Sign: WPZR700, Assigned Frequencies: 5350.00 MHz, Grant Date: 02/27/2004, Expiration Date: 08/27/2004, Cancellation Date: 10/30/2004, Certifier: Jeffrey R Blum, Registrant: Piper Rudnick, LLP, 1200 19th St., Nw, Suite 700, Washington, DC 20036, Phone: (202) 861-3983, Fax: (202) 689-7544, Email:
115-MASTIC-SHIRLEY, Mta - Rail Stion Mastic - Shirley (Lat: 40.798333 Lon: -72.865556), Type: Bant, Structure height: 15.3 m, Call Sign: WQEC759, Assigned Frequencies: 851.037 MHz, 851.537 MHz, 852.037 MHz, 852.537 MHz, 853.037 MHz, Grant Date: 12/28/2005, Expiration Date: 12/28/2015, Cancellation Date: 01/14/2011, Certifier: Thomas J Cowper, Registrant: Nys Dhses Office Of Interoperable And Emergency Communications, State Office Campus Building 22, 1220 Washington Ave, Albany, NY 12226, Phone: (518) 322-4912, Fax: (518) 322-4975, Email:
1300 William Floyd Pkwy (Lat: 40.827889 Lon: -72.880944), Call Sign: WQGJ647, Assigned Frequencies: 463.200 MHz, 464.150 MHz, Grant Date: 02/07/2007, Expiration Date: 02/07/2017, Cancellation Date: 04/15/2017, Certifier: Thomas Downs, Registrant: T.L.P. Technologies Inc., Westhampton Beach, NY 11978-7309, Phone: (631) 288-8228, Fax: (631) 288-5788, Email:
Lat: 40.847306 Lon: -72.874250, Call Sign: WRJC824, Assigned Frequencies: 452.112 MHz, 457.112 MHz, Grant Date: 08/07/2020, Expiration Date: 08/07/2030, Certifier: Karen Fischbach, Registrant: Bearcom, 4009 Distribution Drive, Bldg 200, Garland, TX 75041, Phone: (214) 765-7328, Email:
FCC Registered Microwave Towers: 5 (
See the full list of FCC Registered Microwave Towers in this town )
FCC Registered Maritime Coast & Aviation Ground Towers: 3 (
See the full list of FCC Registered Maritime Coast & Aviation Ground Towers )
FCC Registered Amateur Radio Licenses: 92 (
See the full list of FCC Registered Amateur Radio Licenses in Shirley )
FAA Registered Aircraft: 12 (
See the full list of FAA Registered Aircraft in Shirley )
Home Mortgage Disclosure Act Aggregated Statistics For Year 2009(Based on 4 full tracts) A) FHA, FSA/RHS & VA B) Conventional C) Refinancings D) Home Improvement Loans F) Non-occupant Loans on Number Average Value Number Average Value Number Average Value Number Average Value Number Average Value
LOANS ORIGINATED 91 $225,220 42 $182,786 253 $190,296 26 $63,077 9 $150,444 APPLICATIONS APPROVED, NOT ACCEPTED 8 $269,500 10 $129,500 31 $169,742 3 $240,000 2 $104,500 APPLICATIONS DENIED 25 $208,200 17 $166,941 210 $214,576 36 $55,778 7 $108,857 APPLICATIONS WITHDRAWN 25 $220,200 10 $159,500 118 $226,780 5 $83,600 4 $112,750 FILES CLOSED FOR INCOMPLETENESS 4 $190,750 2 $163,500 31 $226,613 9 $118,111 1 $173,000
Aggregated Statistics For Year 2008(Based on 4 full tracts) A) FHA, FSA/RHS & VA B) Conventional C) Refinancings D) Home Improvement Loans F) Non-occupant Loans on G) Loans On Manufactured Number Average Value Number Average Value Number Average Value Number Average Value Number Average Value Number Average Value
LOANS ORIGINATED 74 $254,514 87 $224,839 236 $199,292 71 $68,423 21 $180,667 1 $45,000 APPLICATIONS APPROVED, NOT ACCEPTED 2 $228,500 17 $203,353 57 $210,825 14 $24,500 4 $157,750 1 $7,000 APPLICATIONS DENIED 15 $251,400 52 $247,365 288 $239,670 93 $73,860 22 $149,091 0 $0 APPLICATIONS WITHDRAWN 14 $244,000 25 $231,240 90 $255,367 20 $97,050 7 $254,429 0 $0 FILES CLOSED FOR INCOMPLETENESS 2 $216,000 12 $269,583 31 $250,290 6 $75,000 1 $248,000 0 $0
Aggregated Statistics For Year 2007(Based on 4 full tracts) A) FHA, FSA/RHS & VA B) Conventional C) Refinancings D) Home Improvement Loans F) Non-occupant Loans on G) Loans On Manufactured Number Average Value Number Average Value Number Average Value Number Average Value Number Average Value Number Average Value
LOANS ORIGINATED 30 $304,867 313 $216,150 589 $209,934 141 $84,199 49 $212,408 0 $0 APPLICATIONS APPROVED, NOT ACCEPTED 1 $260,000 79 $193,291 157 $217,732 33 $73,061 9 $223,000 1 $109,000 APPLICATIONS DENIED 6 $291,000 168 $257,131 585 $249,949 134 $94,582 33 $253,424 2 $83,000 APPLICATIONS WITHDRAWN 9 $296,556 43 $239,512 246 $228,293 25 $98,320 10 $207,200 0 $0 FILES CLOSED FOR INCOMPLETENESS 0 $0 21 $226,429 97 $244,557 8 $112,750 1 $272,000 0 $0
Aggregated Statistics For Year 2006(Based on 4 full tracts) A) FHA, FSA/RHS & VA B) Conventional C) Refinancings D) Home Improvement Loans F) Non-occupant Loans on G) Loans On Manufactured Number Average Value Number Average Value Number Average Value Number Average Value Number Average Value Number Average Value
LOANS ORIGINATED 21 $307,476 565 $190,471 919 $204,029 171 $98,386 77 $197,052 2 $157,000 APPLICATIONS APPROVED, NOT ACCEPTED 0 $0 85 $188,859 216 $192,130 38 $85,658 22 $154,864 0 $0 APPLICATIONS DENIED 3 $300,000 206 $201,767 717 $225,653 140 $87,529 51 $187,255 3 $140,333 APPLICATIONS WITHDRAWN 1 $294,000 100 $201,170 440 $228,041 70 $116,771 21 $226,381 0 $0 FILES CLOSED FOR INCOMPLETENESS 0 $0 26 $231,692 154 $234,240 10 $111,500 5 $203,000 0 $0
Aggregated Statistics For Year 2005(Based on 4 full tracts) A) FHA, FSA/RHS & VA B) Conventional C) Refinancings D) Home Improvement Loans E) Loans on Dwellings For 5+ Families F) Non-occupant Loans on G) Loans On Manufactured Number Average Value Number Average Value Number Average Value Number Average Value Number Average Value Number Average Value Number Average Value
LOANS ORIGINATED 18 $276,722 687 $198,702 1,170 $198,191 171 $92,205 1 $210,000 90 $198,489 1 $72,000 APPLICATIONS APPROVED, NOT ACCEPTED 0 $0 91 $208,341 177 $189,299 41 $71,756 0 $0 10 $122,400 0 $0 APPLICATIONS DENIED 6 $269,833 178 $196,146 590 $216,563 163 $105,681 0 $0 32 $175,000 2 $38,000 APPLICATIONS WITHDRAWN 5 $279,600 154 $204,812 501 $199,393 61 $161,180 0 $0 31 $234,258 0 $0 FILES CLOSED FOR INCOMPLETENESS 1 $241,000 63 $172,635 320 $224,778 15 $75,067 0 $0 7 $121,714 0 $0
Aggregated Statistics For Year 2004(Based on 4 full tracts) A) FHA, FSA/RHS & VA B) Conventional C) Refinancings D) Home Improvement Loans F) Non-occupant Loans on G) Loans On Manufactured Number Average Value Number Average Value Number Average Value Number Average Value Number Average Value Number Average Value
LOANS ORIGINATED 54 $243,463 567 $199,487 1,199 $175,103 222 $91,378 101 $171,228 11 $52,091 APPLICATIONS APPROVED, NOT ACCEPTED 5 $236,000 96 $223,167 281 $182,968 42 $79,714 24 $185,417 0 $0 APPLICATIONS DENIED 11 $231,364 159 $200,635 605 $182,947 192 $75,370 30 $168,700 1 $10,000 APPLICATIONS WITHDRAWN 9 $240,333 101 $207,772 553 $176,685 63 $103,762 23 $175,739 1 $225,000 FILES CLOSED FOR INCOMPLETENESS 1 $257,000 32 $192,031 253 $200,510 14 $50,429 7 $199,714 0 $0
Aggregated Statistics For Year 2003(Based on 4 full tracts) A) FHA, FSA/RHS & VA B) Conventional C) Refinancings D) Home Improvement Loans F) Non-occupant Loans on Number Average Value Number Average Value Number Average Value Number Average Value Number Average Value
LOANS ORIGINATED 114 $196,316 502 $181,010 1,853 $144,848 156 $31,167 104 $137,788 APPLICATIONS APPROVED, NOT ACCEPTED 8 $201,875 72 $196,069 365 $143,748 54 $34,556 22 $155,182 APPLICATIONS DENIED 11 $229,182 106 $179,047 764 $150,283 151 $32,887 40 $137,275 APPLICATIONS WITHDRAWN 26 $222,962 83 $169,699 660 $154,715 50 $40,760 27 $134,000 FILES CLOSED FOR INCOMPLETENESS 4 $181,250 20 $165,000 99 $158,576 13 $53,538 4 $129,500
Aggregated Statistics For Year 2002(Based on 4 full tracts) A) FHA, FSA/RHS & VA B) Conventional C) Refinancings D) Home Improvement Loans E) Loans on Dwellings For 5+ Families F) Non-occupant Loans on Number Average Value Number Average Value Number Average Value Number Average Value Number Average Value Number Average Value
LOANS ORIGINATED 140 $166,764 422 $152,922 1,171 $123,889 170 $31,465 1 $55,000 78 $116,410 APPLICATIONS APPROVED, NOT ACCEPTED 10 $169,000 65 $155,877 214 $123,626 44 $38,091 0 $0 6 $103,000 APPLICATIONS DENIED 31 $179,677 107 $143,103 542 $113,493 149 $32,678 0 $0 30 $128,400 APPLICATIONS WITHDRAWN 22 $163,500 61 $160,197 516 $127,248 91 $38,978 0 $0 17 $101,235 FILES CLOSED FOR INCOMPLETENESS 8 $171,375 23 $171,783 161 $122,000 4 $25,750 0 $0 8 $148,125
Aggregated Statistics For Year 2001(Based on 4 full tracts) A) FHA, FSA/RHS & VA B) Conventional C) Refinancings D) Home Improvement Loans E) Loans on Dwellings For 5+ Families F) Non-occupant Loans on Number Average Value Number Average Value Number Average Value Number Average Value Number Average Value Number Average Value
LOANS ORIGINATED 150 $137,773 376 $130,380 740 $104,877 142 $32,852 1 $167,000 39 $104,462 APPLICATIONS APPROVED, NOT ACCEPTED 9 $139,556 38 $132,289 159 $88,000 50 $23,300 0 $0 12 $94,750 APPLICATIONS DENIED 31 $147,323 85 $129,659 539 $97,061 155 $26,213 0 $0 32 $100,938 APPLICATIONS WITHDRAWN 36 $150,139 42 $119,238 372 $106,726 64 $30,953 0 $0 10 $93,700 FILES CLOSED FOR INCOMPLETENESS 7 $129,286 7 $156,714 76 $108,289 5 $38,400 0 $0 3 $56,667
Aggregated Statistics For Year 2000(Based on 4 full tracts) A) FHA, FSA/RHS & VA B) Conventional C) Refinancings D) Home Improvement Loans E) Loans on Dwellings For 5+ Families F) Non-occupant Loans on Number Average Value Number Average Value Number Average Value Number Average Value Number Average Value Number Average Value
LOANS ORIGINATED 169 $119,805 282 $109,117 271 $80,118 138 $23,609 0 $0 31 $92,323 APPLICATIONS APPROVED, NOT ACCEPTED 10 $122,000 35 $106,114 100 $78,210 45 $27,600 0 $0 4 $48,750 APPLICATIONS DENIED 36 $115,833 121 $107,967 289 $79,699 149 $25,564 1 $46,000 6 $132,000 APPLICATIONS WITHDRAWN 32 $132,438 47 $104,191 321 $70,246 20 $38,850 0 $0 10 $74,300 FILES CLOSED FOR INCOMPLETENESS 14 $107,571 11 $104,273 42 $98,571 3 $27,667 0 $0 2 $98,000
Aggregated Statistics For Year 1999(Based on 4 full tracts) A) FHA, FSA/RHS & VA B) Conventional C) Refinancings D) Home Improvement Loans F) Non-occupant Loans on Number Average Value Number Average Value Number Average Value Number Average Value Number Average Value
LOANS ORIGINATED 156 $104,429 261 $95,487 341 $82,511 124 $18,135 42 $71,571 APPLICATIONS APPROVED, NOT ACCEPTED 8 $113,508 51 $102,312 135 $80,654 36 $31,065 7 $62,059 APPLICATIONS DENIED 27 $92,868 77 $97,849 322 $78,231 86 $24,330 11 $74,957 APPLICATIONS WITHDRAWN 32 $114,488 37 $99,120 319 $77,452 20 $55,853 11 $97,594 FILES CLOSED FOR INCOMPLETENESS 11 $100,304 16 $96,164 64 $95,619 1 $39,700 3 $89,767
Detailed HMDA statistics for the following Tracts:
1594.07
, 1594.08 , 1595.05 , 1595.06
Private Mortgage Insurance Companies Aggregated Statistics For Year 2009(Based on 4 full tracts) A) Conventional B) Refinancings Number Average Value Number Average Value
LOANS ORIGINATED 15 $224,133 9 $243,000 APPLICATIONS APPROVED, NOT ACCEPTED 7 $209,714 2 $331,000 APPLICATIONS DENIED 5 $204,400 7 $278,000 APPLICATIONS WITHDRAWN 2 $175,500 3 $285,333 FILES CLOSED FOR INCOMPLETENESS 0 $0 0 $0
Aggregated Statistics For Year 2008(Based on 4 full tracts) A) Conventional B) Refinancings C) Non-occupant Loans on Number Average Value Number Average Value Number Average Value
LOANS ORIGINATED 43 $250,953 24 $299,375 1 $248,000 APPLICATIONS APPROVED, NOT ACCEPTED 36 $264,250 36 $309,056 5 $239,400 APPLICATIONS DENIED 15 $239,667 5 $271,200 5 $252,000 APPLICATIONS WITHDRAWN 7 $274,571 2 $291,000 1 $375,000 FILES CLOSED FOR INCOMPLETENESS 1 $274,000 0 $0 0 $0
Aggregated Statistics For Year 2007(Based on 4 full tracts) A) Conventional B) Refinancings C) Non-occupant Loans on Number Average Value Number Average Value Number Average Value
LOANS ORIGINATED 97 $277,144 55 $309,600 5 $303,800 APPLICATIONS APPROVED, NOT ACCEPTED 29 $278,586 17 $309,176 1 $267,000 APPLICATIONS DENIED 2 $149,000 5 $292,600 1 $149,000 APPLICATIONS WITHDRAWN 9 $355,333 4 $337,500 0 $0 FILES CLOSED FOR INCOMPLETENESS 1 $385,000 2 $251,500 0 $0
Aggregated Statistics For Year 2006(Based on 4 full tracts) A) Conventional B) Refinancings C) Non-occupant Loans on D) Loans On Manufactured Number Average Value Number Average Value Number Average Value Number Average Value
LOANS ORIGINATED 47 $284,234 31 $290,290 1 $247,000 0 $0 APPLICATIONS APPROVED, NOT ACCEPTED 11 $276,000 11 $295,455 0 $0 0 $0 APPLICATIONS DENIED 0 $0 2 $326,500 0 $0 0 $0 APPLICATIONS WITHDRAWN 8 $278,375 3 $286,667 0 $0 1 $319,000 FILES CLOSED FOR INCOMPLETENESS 0 $0 0 $0 0 $0 0 $0
Aggregated Statistics For Year 2005(Based on 4 full tracts) A) Conventional B) Refinancings C) Non-occupant Loans on Number Average Value Number Average Value Number Average Value
LOANS ORIGINATED 90 $266,656 21 $274,810 5 $221,000 APPLICATIONS APPROVED, NOT ACCEPTED 29 $258,862 15 $253,533 0 $0 APPLICATIONS DENIED 3 $239,667 1 $280,000 1 $288,000 APPLICATIONS WITHDRAWN 14 $288,143 7 $250,429 2 $218,500 FILES CLOSED FOR INCOMPLETENESS 2 $239,500 1 $271,000 0 $0
Aggregated Statistics For Year 2004(Based on 4 full tracts) A) Conventional B) Refinancings C) Non-occupant Loans on D) Loans On Manufactured Number Average Value Number Average Value Number Average Value Number Average Value
LOANS ORIGINATED 142 $238,394 37 $203,703 9 $201,222 0 $0 APPLICATIONS APPROVED, NOT ACCEPTED 36 $244,972 18 $198,278 6 $207,000 0 $0 APPLICATIONS DENIED 6 $240,500 0 $0 1 $158,000 0 $0 APPLICATIONS WITHDRAWN 15 $240,733 5 $225,600 5 $190,400 0 $0 FILES CLOSED FOR INCOMPLETENESS 2 $142,500 1 $271,000 0 $0 1 $100,000
Aggregated Statistics For Year 2003(Based on 4 full tracts) A) Conventional B) Refinancings C) Non-occupant Loans on Number Average Value Number Average Value Number Average Value
LOANS ORIGINATED 187 $203,701 76 $184,355 10 $186,100 APPLICATIONS APPROVED, NOT ACCEPTED 64 $186,984 28 $183,179 5 $165,200 APPLICATIONS DENIED 7 $216,286 1 $198,000 1 $233,000 APPLICATIONS WITHDRAWN 11 $181,909 3 $186,000 0 $0 FILES CLOSED FOR INCOMPLETENESS 1 $184,000 0 $0 0 $0
Aggregated Statistics For Year 2002(Based on 4 full tracts) A) Conventional B) Refinancings C) Non-occupant Loans on Number Average Value Number Average Value Number Average Value
LOANS ORIGINATED 204 $165,127 69 $161,188 11 $125,273 APPLICATIONS APPROVED, NOT ACCEPTED 63 $152,841 38 $157,447 4 $112,250 APPLICATIONS DENIED 5 $162,000 2 $192,000 0 $0 APPLICATIONS WITHDRAWN 11 $155,455 1 $275,000 2 $147,500 FILES CLOSED FOR INCOMPLETENESS 2 $146,000 0 $0 1 $111,000
Aggregated Statistics For Year 2001(Based on 4 full tracts) A) Conventional B) Refinancings C) Non-occupant Loans on Number Average Value Number Average Value Number Average Value
LOANS ORIGINATED 185 $138,157 62 $139,597 13 $105,000 APPLICATIONS APPROVED, NOT ACCEPTED 50 $150,040 25 $138,560 4 $109,250 APPLICATIONS DENIED 10 $142,400 3 $137,333 4 $119,000 APPLICATIONS WITHDRAWN 4 $147,000 1 $78,000 1 $153,000 FILES CLOSED FOR INCOMPLETENESS 6 $112,500 0 $0 1 $72,000
Aggregated Statistics For Year 2000(Based on 4 full tracts) A) Conventional B) Refinancings C) Non-occupant Loans on Number Average Value Number Average Value Number Average Value
LOANS ORIGINATED 158 $112,291 15 $115,200 15 $76,000 APPLICATIONS APPROVED, NOT ACCEPTED 20 $111,150 4 $113,250 0 $0 APPLICATIONS DENIED 11 $122,273 1 $126,000 1 $73,000 APPLICATIONS WITHDRAWN 4 $113,250 1 $117,000 0 $0 FILES CLOSED FOR INCOMPLETENESS 1 $116,000 0 $0 0 $0
Aggregated Statistics For Year 1999(Based on 4 full tracts) A) Conventional B) Refinancings C) Non-occupant Loans on Number Average Value Number Average Value Number Average Value
LOANS ORIGINATED 118 $107,854 27 $96,602 6 $79,512 APPLICATIONS APPROVED, NOT ACCEPTED 12 $115,805 15 $99,029 1 $51,600 APPLICATIONS DENIED 20 $97,650 2 $126,520 2 $68,485 APPLICATIONS WITHDRAWN 5 $101,026 3 $102,300 0 $0 FILES CLOSED FOR INCOMPLETENESS 1 $124,420 4 $102,860 0 $0
Detailed PMIC statistics for the following Tracts:
1594.07
, 1594.08 , 1595.05 , 1595.06
Most common first names in Shirley, NY among deceased individuals Name Count Lived (average)
John 153 73.0 years Joseph 124 71.1 years William 79 70.5 years Mary 76 74.6 years Frank 70 72.9 years Charles 56 72.6 years Anna 54 78.4 years Anthony 54 65.5 years Michael 53 64.5 years Robert 50 64.6 years
Most common last names in Shirley, NY among deceased individuals Last name Count Lived (average)
Smith 11 67.6 years Williams 9 71.7 years Barone 8 75.8 years Rizzo 8 71.8 years Russo 8 62.9 years Bruno 7 67.7 years Johnson 7 60.8 years Taylor 7 63.6 years Barnes 6 75.1 years Martin 6 72.7 years
Shirley compared to New York state average:
Unemployed percentage below state average. Black race population percentage below state average. Median age below state average. Foreign-born population percentage below state average. Renting percentage significantly below state average. Length of stay since moving in above state average. Number of rooms per house above state average. House age below state average.
#20 on the list of "Top 100 low-educated but high-earning cities (pop. 5,000+)"
#44 on the list of "Top 101 cities with the most people living the same house as 1 year ago (population 5,000+))"
#55 on the list of "Top 101 cities with the most residents born in Pakistan (population 500+)"
#3 on the list of "Top 101 counties with the most Catholic adherents"
#6 on the list of "Top 101 counties with the lowest percentage of residents relocating from other counties between 2010 and 2011"
#7 on the list of "Top 101 counties with the lowest surface withdrawal of fresh water for public supply (pop. 50,000+)"
#9 on the list of "Top 101 counties with the lowest percentage of residents relocating to other counties in 2011"
#19 on the list of "Top 101 counties with the highest ground withdrawal of fresh water for public supply (pop. 50,000+)"
Top Patent Applicants
Carl Degiovine (7)
Matthew D. Blasczak (3)
Robert W. Digiovanna (3)
Steven E. Summer (2)
Dean Connor (1)
George Dellaratta, Jr. (1)
Christopher Dean Smith (1)
Joseph J. Vernice (1)
Charles J Stronconi (1)
Rene Wischhusen (1)
Total of 36 patent applications in 2008-2024.

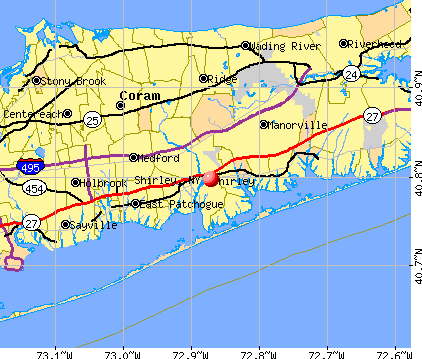


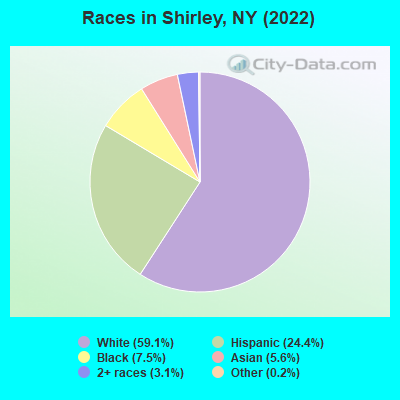
 Recent articles from our blog. Our writers, many of them Ph.D. graduates or candidates, create easy-to-read articles on a wide variety of topics.


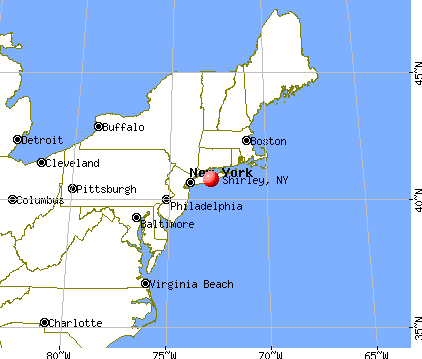
 (19.6 miles
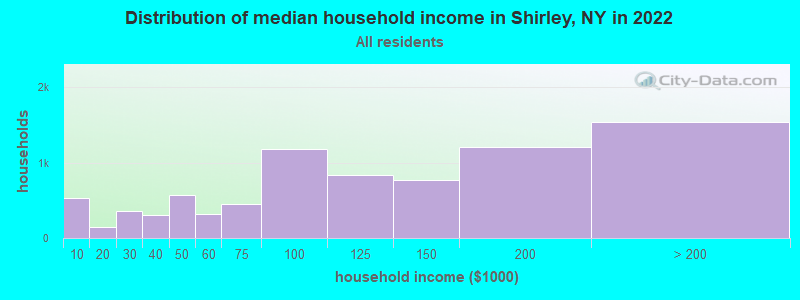
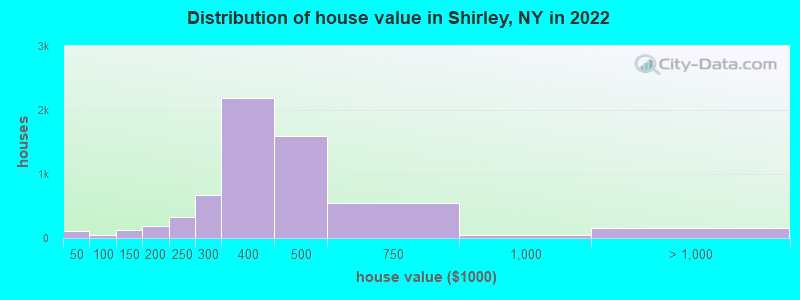
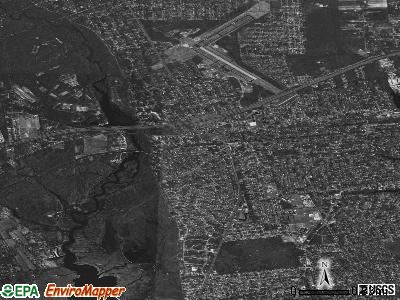
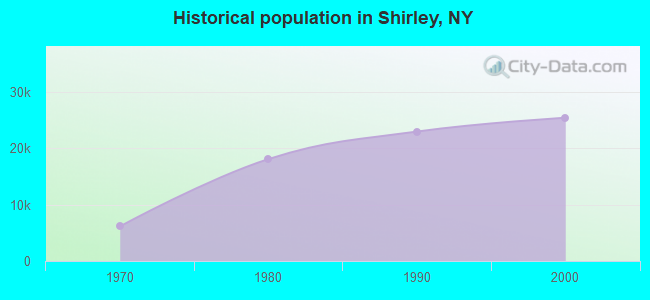
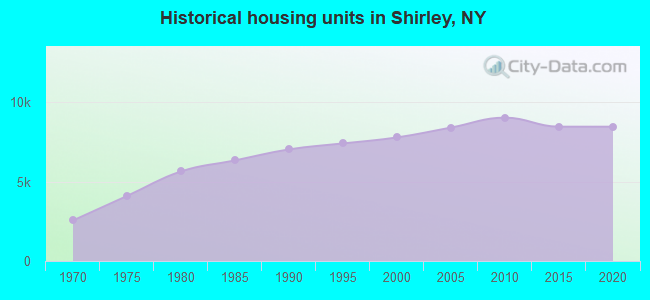
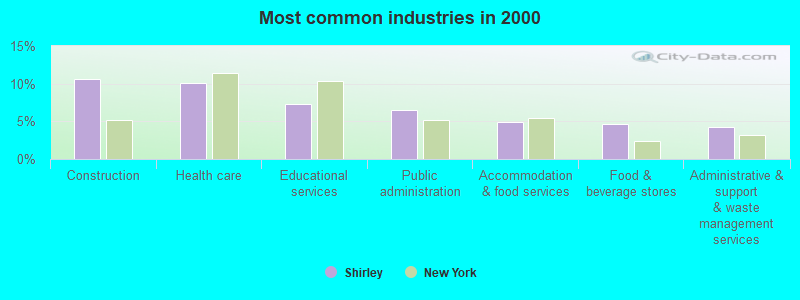
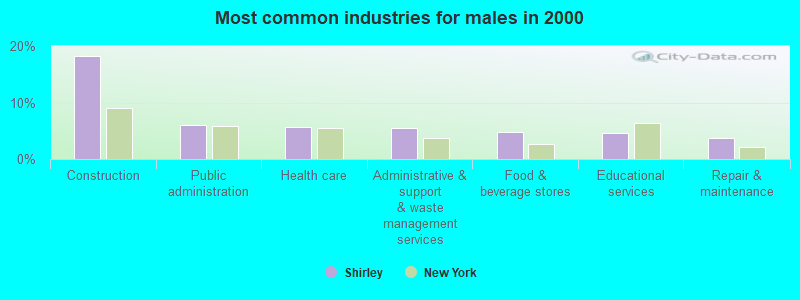
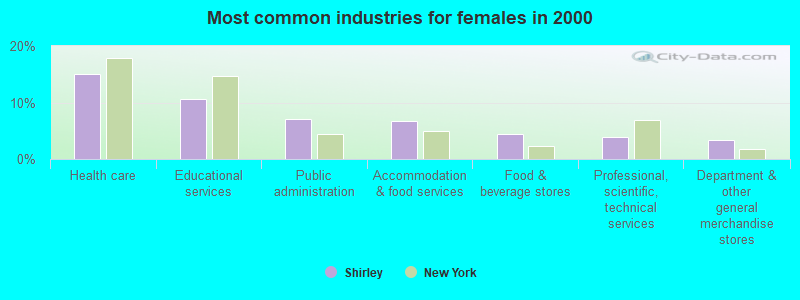
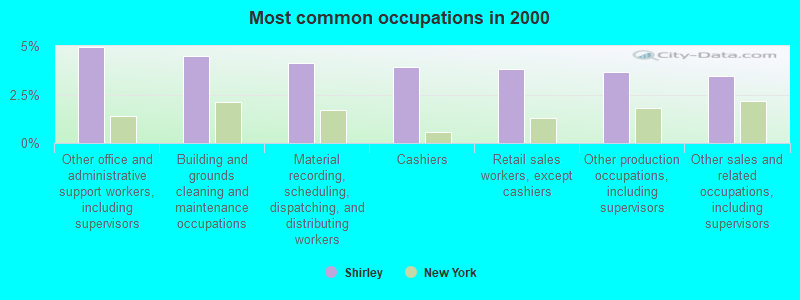
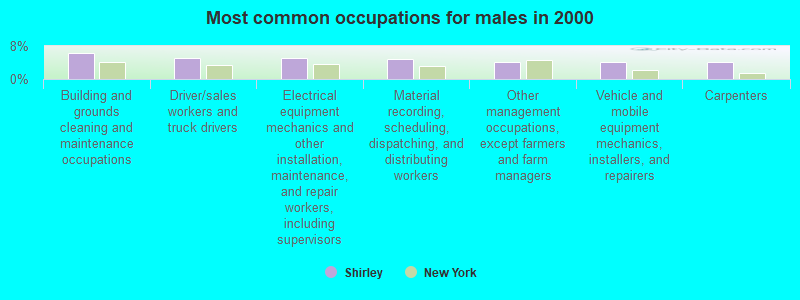
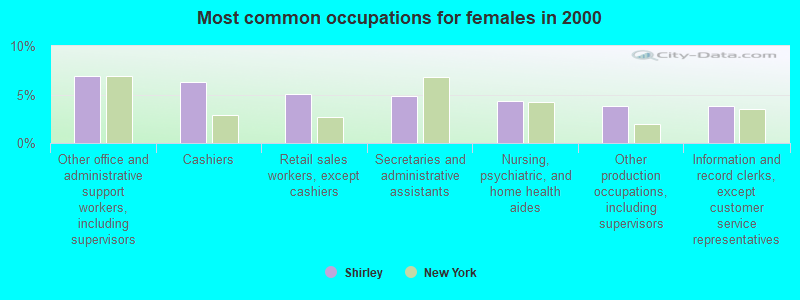
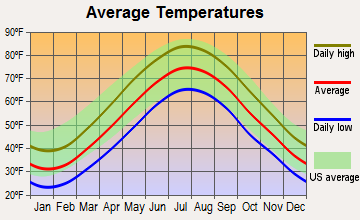
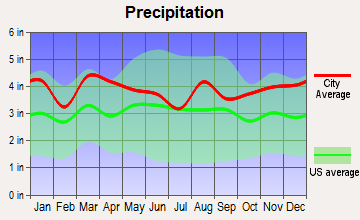
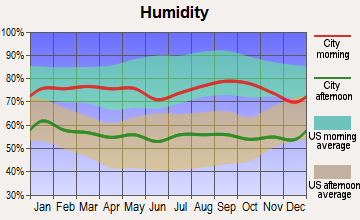
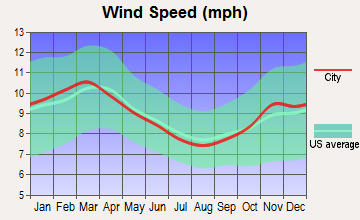
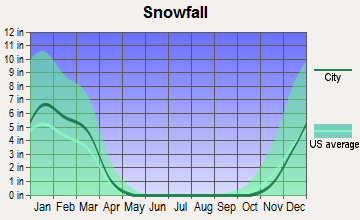
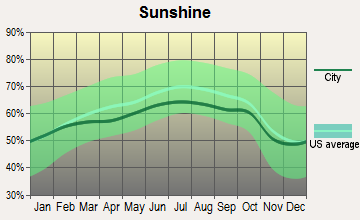
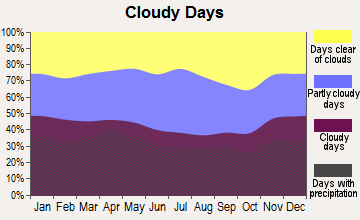
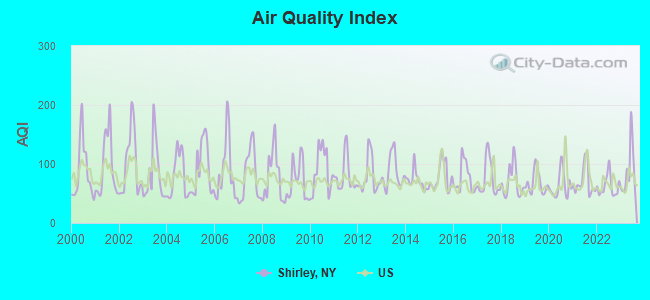
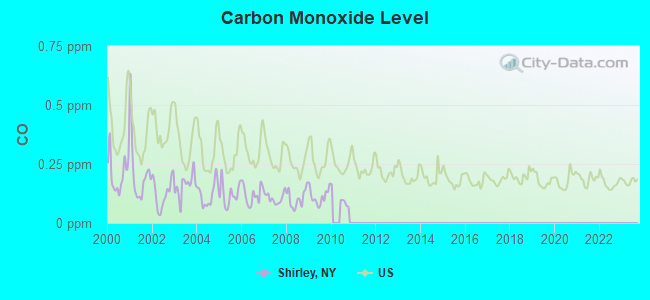
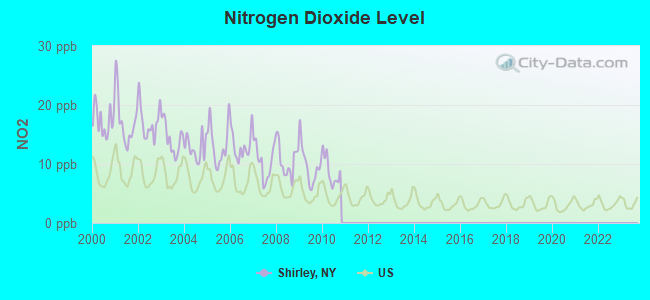
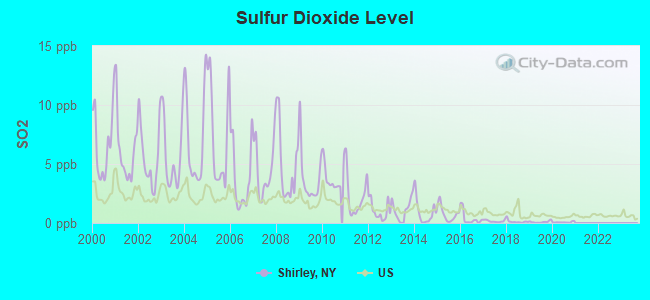
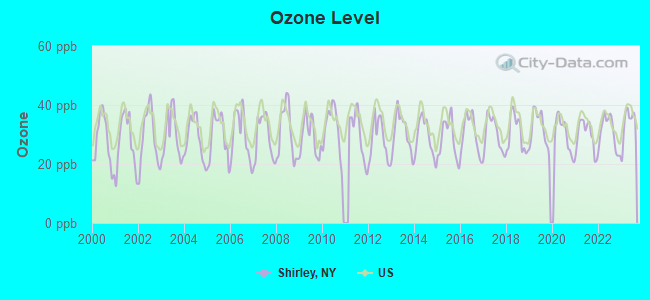
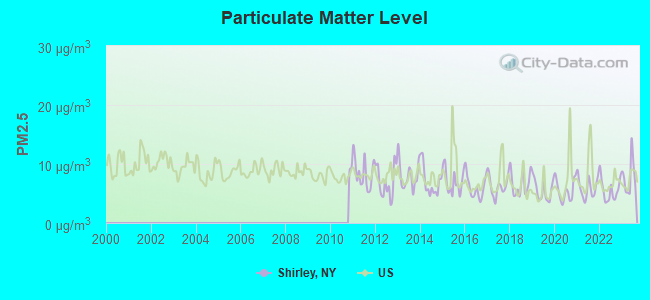

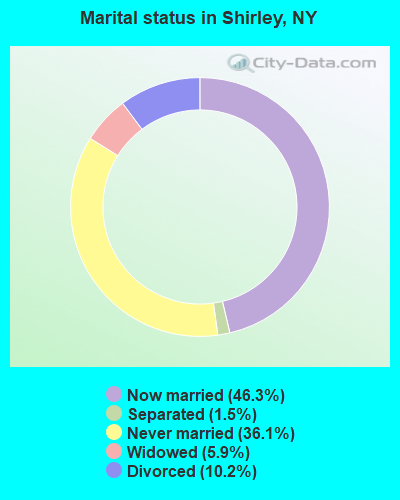
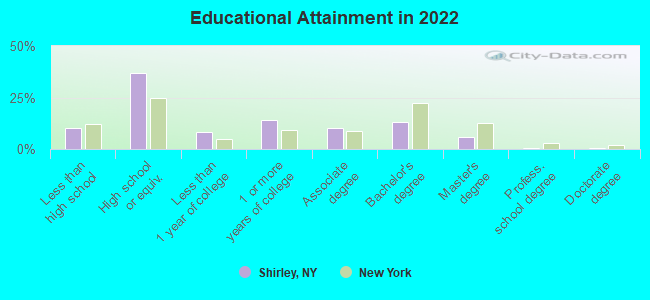
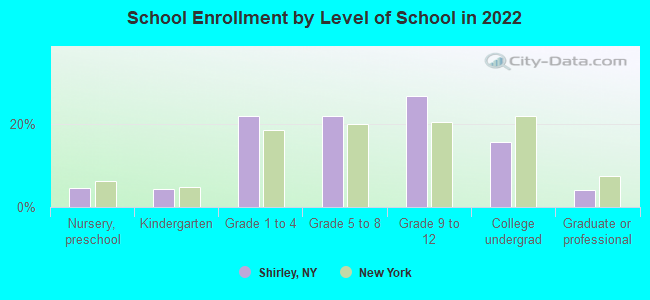
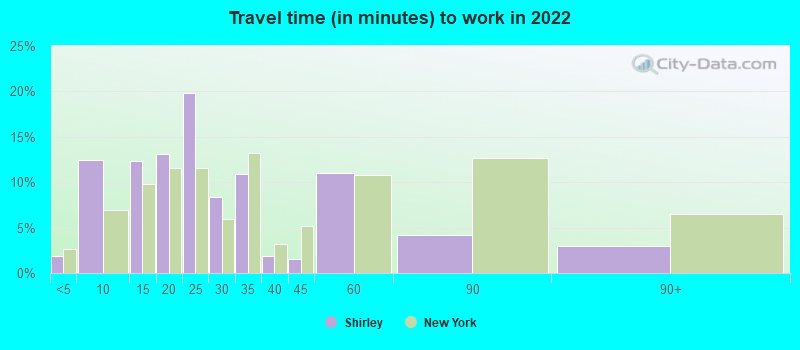
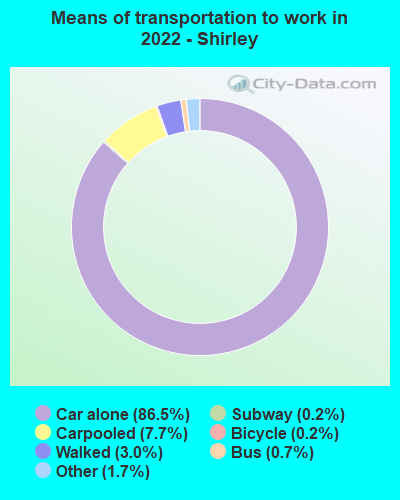


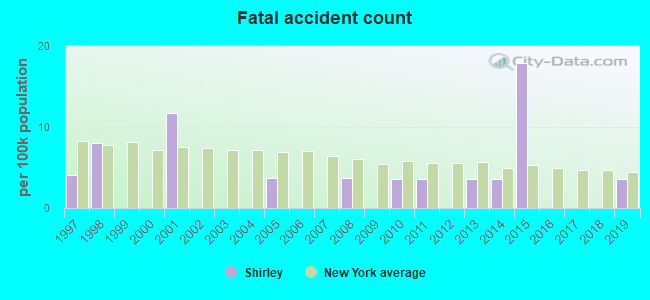
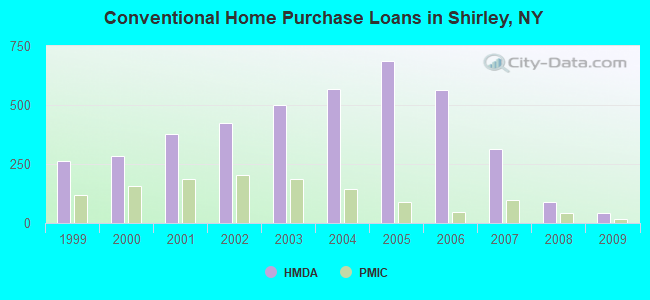
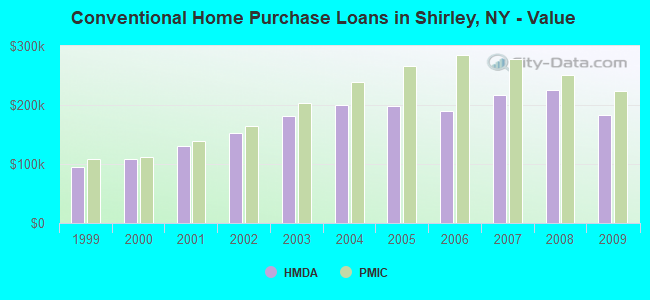
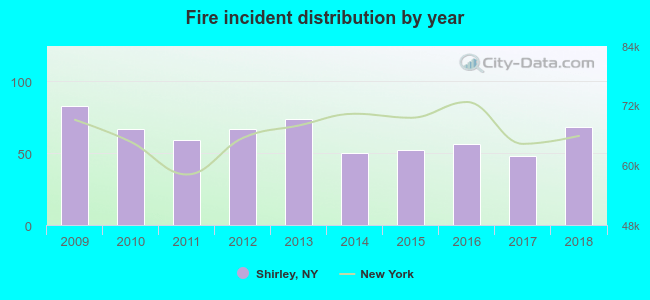 According to the data from the years 2009 - 2018 the average number of fire incidents per year is 62. The highest number of reported fire incidents - 83 took place in 2009, and the least - 48 in 2017. The data has a declining trend.
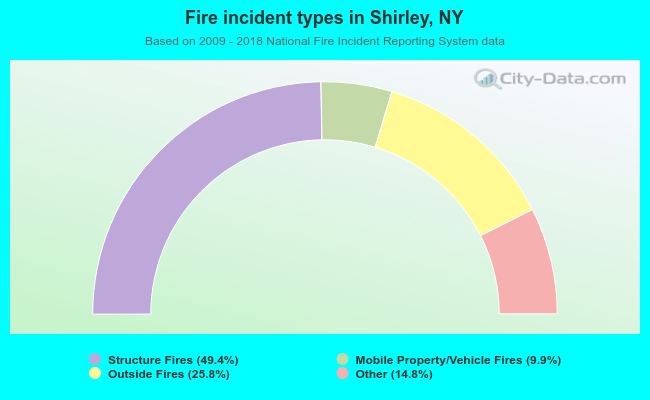 When looking into fire subcategories, the most incidents belonged to: Structure Fires (49.4%), and Outside Fires (25.8%).