Farmingdale, New York Submit your own pictures of this village and show them to the world
OSM Map
General Map
Google Map
MSN Map
OSM Map
General Map
Google Map
MSN Map
OSM Map
General Map
Google Map
MSN Map
OSM Map
General Map
Google Map
MSN Map
Please wait while loading the map...
Population in 2022: 8,369 (100% urban, 0% rural). Population change since 2000: -0.4%Males: 4,138 Females: 4,231
March 2022 cost of living index in Farmingdale: 151.5 (very high, U.S. average is 100) Percentage of residents living in poverty in 2022: 4.6%for White Non-Hispanic residents , 6.7% for Black residents , 2.4% for Hispanic or Latino residents , 3.6% for other race residents , 4.5% for two or more races residents )
Profiles of local businesses
Business Search - 14 Million verified businesses
Data:
Median household income ($)
Median household income (% change since 2000)
Household income diversity
Ratio of average income to average house value (%)
Ratio of average income to average rent
Median household income ($) - White
Median household income ($) - Black or African American
Median household income ($) - Asian
Median household income ($) - Hispanic or Latino
Median household income ($) - American Indian and Alaska Native
Median household income ($) - Multirace
Median household income ($) - Other Race
Median household income for houses/condos with a mortgage ($)
Median household income for apartments without a mortgage ($)
Races - White alone (%)
Races - White alone (% change since 2000)
Races - Black alone (%)
Races - Black alone (% change since 2000)
Races - American Indian alone (%)
Races - American Indian alone (% change since 2000)
Races - Asian alone (%)
Races - Asian alone (% change since 2000)
Races - Hispanic (%)
Races - Hispanic (% change since 2000)
Races - Native Hawaiian and Other Pacific Islander alone (%)
Races - Native Hawaiian and Other Pacific Islander alone (% change since 2000)
Races - Two or more races (%)
Races - Two or more races (% change since 2000)
Races - Other race alone (%)
Races - Other race alone (% change since 2000)
Racial diversity
Unemployment (%)
Unemployment (% change since 2000)
Unemployment (%) - White
Unemployment (%) - Black or African American
Unemployment (%) - Asian
Unemployment (%) - Hispanic or Latino
Unemployment (%) - American Indian and Alaska Native
Unemployment (%) - Multirace
Unemployment (%) - Other Race
Population density (people per square mile)
Population - Males (%)
Population - Females (%)
Population - Males (%) - White
Population - Males (%) - Black or African American
Population - Males (%) - Asian
Population - Males (%) - Hispanic or Latino
Population - Males (%) - American Indian and Alaska Native
Population - Males (%) - Multirace
Population - Males (%) - Other Race
Population - Females (%) - White
Population - Females (%) - Black or African American
Population - Females (%) - Asian
Population - Females (%) - Hispanic or Latino
Population - Females (%) - American Indian and Alaska Native
Population - Females (%) - Multirace
Population - Females (%) - Other Race
Coronavirus confirmed cases (May 21, 2024)
Deaths caused by coronavirus (May 21, 2024)
Coronavirus confirmed cases (per 100k population) (May 21, 2024)
Deaths caused by coronavirus (per 100k population) (May 21, 2024)
Daily increase in number of cases (May 21, 2024)
Weekly increase in number of cases (May 21, 2024)
Cases doubled (in days) (May 21, 2024)
Hospitalized patients (Apr 18, 2022)
Negative test results (Apr 18, 2022)
Total test results (Apr 18, 2022)
COVID Vaccine doses distributed (per 100k population) (Sep 19, 2023)
COVID Vaccine doses administered (per 100k population) (Sep 19, 2023)
COVID Vaccine doses distributed (Sep 19, 2023)
COVID Vaccine doses administered (Sep 19, 2023)
Likely homosexual households (%)
Likely homosexual households (% change since 2000)
Likely homosexual households - Lesbian couples (%)
Likely homosexual households - Lesbian couples (% change since 2000)
Likely homosexual households - Gay men (%)
Likely homosexual households - Gay men (% change since 2000)
Cost of living index
Median gross rent ($)
Median contract rent ($)
Median monthly housing costs ($)
Median house or condo value ($)
Median house or condo value ($ change since 2000)
Mean house or condo value by units in structure - 1, detached ($)
Mean house or condo value by units in structure - 1, attached ($)
Mean house or condo value by units in structure - 2 ($)
Mean house or condo value by units in structure by units in structure - 3 or 4 ($)
Mean house or condo value by units in structure - 5 or more ($)
Mean house or condo value by units in structure - Boat, RV, van, etc. ($)
Mean house or condo value by units in structure - Mobile home ($)
Median house or condo value ($) - White
Median house or condo value ($) - Black or African American
Median house or condo value ($) - Asian
Median house or condo value ($) - Hispanic or Latino
Median house or condo value ($) - American Indian and Alaska Native
Median house or condo value ($) - Multirace
Median house or condo value ($) - Other Race
Median resident age
Resident age diversity
Median resident age - Males
Median resident age - Females
Median resident age - White
Median resident age - Black or African American
Median resident age - Asian
Median resident age - Hispanic or Latino
Median resident age - American Indian and Alaska Native
Median resident age - Multirace
Median resident age - Other Race
Median resident age - Males - White
Median resident age - Males - Black or African American
Median resident age - Males - Asian
Median resident age - Males - Hispanic or Latino
Median resident age - Males - American Indian and Alaska Native
Median resident age - Males - Multirace
Median resident age - Males - Other Race
Median resident age - Females - White
Median resident age - Females - Black or African American
Median resident age - Females - Asian
Median resident age - Females - Hispanic or Latino
Median resident age - Females - American Indian and Alaska Native
Median resident age - Females - Multirace
Median resident age - Females - Other Race
Commute - mean travel time to work (minutes)
Travel time to work - Less than 5 minutes (%)
Travel time to work - Less than 5 minutes (% change since 2000)
Travel time to work - 5 to 9 minutes (%)
Travel time to work - 5 to 9 minutes (% change since 2000)
Travel time to work - 10 to 19 minutes (%)
Travel time to work - 10 to 19 minutes (% change since 2000)
Travel time to work - 20 to 29 minutes (%)
Travel time to work - 20 to 29 minutes (% change since 2000)
Travel time to work - 30 to 39 minutes (%)
Travel time to work - 30 to 39 minutes (% change since 2000)
Travel time to work - 40 to 59 minutes (%)
Travel time to work - 40 to 59 minutes (% change since 2000)
Travel time to work - 60 to 89 minutes (%)
Travel time to work - 60 to 89 minutes (% change since 2000)
Travel time to work - 90 or more minutes (%)
Travel time to work - 90 or more minutes (% change since 2000)
Marital status - Never married (%)
Marital status - Now married (%)
Marital status - Separated (%)
Marital status - Widowed (%)
Marital status - Divorced (%)
Median family income ($)
Median family income (% change since 2000)
Median non-family income ($)
Median non-family income (% change since 2000)
Median per capita income ($)
Median per capita income (% change since 2000)
Median family income ($) - White
Median family income ($) - Black or African American
Median family income ($) - Asian
Median family income ($) - Hispanic or Latino
Median family income ($) - American Indian and Alaska Native
Median family income ($) - Multirace
Median family income ($) - Other Race
Median year house/condo built
Median year apartment built
Year house built - Built 2005 or later (%)
Year house built - Built 2000 to 2004 (%)
Year house built - Built 1990 to 1999 (%)
Year house built - Built 1980 to 1989 (%)
Year house built - Built 1970 to 1979 (%)
Year house built - Built 1960 to 1969 (%)
Year house built - Built 1950 to 1959 (%)
Year house built - Built 1940 to 1949 (%)
Year house built - Built 1939 or earlier (%)
Average household size
Household density (households per square mile)
Average household size - White
Average household size - Black or African American
Average household size - Asian
Average household size - Hispanic or Latino
Average household size - American Indian and Alaska Native
Average household size - Multirace
Average household size - Other Race
Occupied housing units (%)
Vacant housing units (%)
Owner occupied housing units (%)
Renter occupied housing units (%)
Vacancy status - For rent (%)
Vacancy status - For sale only (%)
Vacancy status - Rented or sold, not occupied (%)
Vacancy status - For seasonal, recreational, or occasional use (%)
Vacancy status - For migrant workers (%)
Vacancy status - Other vacant (%)
Residents with income below the poverty level (%)
Residents with income below 50% of the poverty level (%)
Children below poverty level (%)
Poor families by family type - Married-couple family (%)
Poor families by family type - Male, no wife present (%)
Poor families by family type - Female, no husband present (%)
Poverty status for native-born residents (%)
Poverty status for foreign-born residents (%)
Poverty among high school graduates not in families (%)
Poverty among people who did not graduate high school not in families (%)
Residents with income below the poverty level (%) - White
Residents with income below the poverty level (%) - Black or African American
Residents with income below the poverty level (%) - Asian
Residents with income below the poverty level (%) - Hispanic or Latino
Residents with income below the poverty level (%) - American Indian and Alaska Native
Residents with income below the poverty level (%) - Multirace
Residents with income below the poverty level (%) - Other Race
Air pollution - Air Quality Index (AQI)
Air pollution - CO
Air pollution - NO2
Air pollution - SO2
Air pollution - Ozone
Air pollution - PM10
Air pollution - PM25
Air pollution - Pb
Crime - Murders per 100,000 population
Crime - Rapes per 100,000 population
Crime - Robberies per 100,000 population
Crime - Assaults per 100,000 population
Crime - Burglaries per 100,000 population
Crime - Thefts per 100,000 population
Crime - Auto thefts per 100,000 population
Crime - Arson per 100,000 population
Crime - City-data.com crime index
Crime - Violent crime index
Crime - Property crime index
Crime - Murders per 100,000 population (5 year average)
Crime - Rapes per 100,000 population (5 year average)
Crime - Robberies per 100,000 population (5 year average)
Crime - Assaults per 100,000 population (5 year average)
Crime - Burglaries per 100,000 population (5 year average)
Crime - Thefts per 100,000 population (5 year average)
Crime - Auto thefts per 100,000 population (5 year average)
Crime - Arson per 100,000 population (5 year average)
Crime - City-data.com crime index (5 year average)
Crime - Violent crime index (5 year average)
Crime - Property crime index (5 year average)
1996 Presidential Elections Results (%) - Democratic Party (Clinton)
1996 Presidential Elections Results (%) - Republican Party (Dole)
1996 Presidential Elections Results (%) - Other
2000 Presidential Elections Results (%) - Democratic Party (Gore)
2000 Presidential Elections Results (%) - Republican Party (Bush)
2000 Presidential Elections Results (%) - Other
2004 Presidential Elections Results (%) - Democratic Party (Kerry)
2004 Presidential Elections Results (%) - Republican Party (Bush)
2004 Presidential Elections Results (%) - Other
2008 Presidential Elections Results (%) - Democratic Party (Obama)
2008 Presidential Elections Results (%) - Republican Party (McCain)
2008 Presidential Elections Results (%) - Other
2012 Presidential Elections Results (%) - Democratic Party (Obama)
2012 Presidential Elections Results (%) - Republican Party (Romney)
2012 Presidential Elections Results (%) - Other
2016 Presidential Elections Results (%) - Democratic Party (Clinton)
2016 Presidential Elections Results (%) - Republican Party (Trump)
2016 Presidential Elections Results (%) - Other
2020 Presidential Elections Results (%) - Democratic Party (Biden)
2020 Presidential Elections Results (%) - Republican Party (Trump)
2020 Presidential Elections Results (%) - Other
Ancestries Reported - Arab (%)
Ancestries Reported - Czech (%)
Ancestries Reported - Danish (%)
Ancestries Reported - Dutch (%)
Ancestries Reported - English (%)
Ancestries Reported - French (%)
Ancestries Reported - French Canadian (%)
Ancestries Reported - German (%)
Ancestries Reported - Greek (%)
Ancestries Reported - Hungarian (%)
Ancestries Reported - Irish (%)
Ancestries Reported - Italian (%)
Ancestries Reported - Lithuanian (%)
Ancestries Reported - Norwegian (%)
Ancestries Reported - Polish (%)
Ancestries Reported - Portuguese (%)
Ancestries Reported - Russian (%)
Ancestries Reported - Scotch-Irish (%)
Ancestries Reported - Scottish (%)
Ancestries Reported - Slovak (%)
Ancestries Reported - Subsaharan African (%)
Ancestries Reported - Swedish (%)
Ancestries Reported - Swiss (%)
Ancestries Reported - Ukrainian (%)
Ancestries Reported - United States (%)
Ancestries Reported - Welsh (%)
Ancestries Reported - West Indian (%)
Ancestries Reported - Other (%)
Educational Attainment - No schooling completed (%)
Educational Attainment - Less than high school (%)
Educational Attainment - High school or equivalent (%)
Educational Attainment - Less than 1 year of college (%)
Educational Attainment - 1 or more years of college (%)
Educational Attainment - Associate degree (%)
Educational Attainment - Bachelor's degree (%)
Educational Attainment - Master's degree (%)
Educational Attainment - Professional school degree (%)
Educational Attainment - Doctorate degree (%)
School Enrollment - Nursery, preschool (%)
School Enrollment - Kindergarten (%)
School Enrollment - Grade 1 to 4 (%)
School Enrollment - Grade 5 to 8 (%)
School Enrollment - Grade 9 to 12 (%)
School Enrollment - College undergrad (%)
School Enrollment - Graduate or professional (%)
School Enrollment - Not enrolled in school (%)
School enrollment - Public schools (%)
School enrollment - Private schools (%)
School enrollment - Not enrolled (%)
Median number of rooms in houses and condos
Median number of rooms in apartments
Housing units lacking complete plumbing facilities (%)
Housing units lacking complete kitchen facilities (%)
Density of houses
Urban houses (%)
Rural houses (%)
Households with people 60 years and over (%)
Households with people 65 years and over (%)
Households with people 75 years and over (%)
Households with one or more nonrelatives (%)
Households with no nonrelatives (%)
Population in households (%)
Family households (%)
Nonfamily households (%)
Population in families (%)
Family households with own children (%)
Median number of bedrooms in owner occupied houses
Mean number of bedrooms in owner occupied houses
Median number of bedrooms in renter occupied houses
Mean number of bedrooms in renter occupied houses
Median number of vehichles in owner occupied houses
Mean number of vehichles in owner occupied houses
Median number of vehichles in renter occupied houses
Mean number of vehichles in renter occupied houses
Mortgage status - with mortgage (%)
Mortgage status - with second mortgage (%)
Mortgage status - with home equity loan (%)
Mortgage status - with both second mortgage and home equity loan (%)
Mortgage status - without a mortgage (%)
Average family size
Average family size - White
Average family size - Black or African American
Average family size - Asian
Average family size - Hispanic or Latino
Average family size - American Indian and Alaska Native
Average family size - Multirace
Average family size - Other Race
Geographical mobility - Same house 1 year ago (%)
Geographical mobility - Moved within same county (%)
Geographical mobility - Moved from different county within same state (%)
Geographical mobility - Moved from different state (%)
Geographical mobility - Moved from abroad (%)
Place of birth - Born in state of residence (%)
Place of birth - Born in other state (%)
Place of birth - Native, outside of US (%)
Place of birth - Foreign born (%)
Housing units in structures - 1, detached (%)
Housing units in structures - 1, attached (%)
Housing units in structures - 2 (%)
Housing units in structures - 3 or 4 (%)
Housing units in structures - 5 to 9 (%)
Housing units in structures - 10 to 19 (%)
Housing units in structures - 20 to 49 (%)
Housing units in structures - 50 or more (%)
Housing units in structures - Mobile home (%)
Housing units in structures - Boat, RV, van, etc. (%)
House/condo owner moved in on average (years ago)
Renter moved in on average (years ago)
Year householder moved into unit - Moved in 1999 to March 2000 (%)
Year householder moved into unit - Moved in 1995 to 1998 (%)
Year householder moved into unit - Moved in 1990 to 1994 (%)
Year householder moved into unit - Moved in 1980 to 1989 (%)
Year householder moved into unit - Moved in 1970 to 1979 (%)
Year householder moved into unit - Moved in 1969 or earlier (%)
Means of transportation to work - Drove car alone (%)
Means of transportation to work - Carpooled (%)
Means of transportation to work - Public transportation (%)
Means of transportation to work - Bus or trolley bus (%)
Means of transportation to work - Streetcar or trolley car (%)
Means of transportation to work - Subway or elevated (%)
Means of transportation to work - Railroad (%)
Means of transportation to work - Ferryboat (%)
Means of transportation to work - Taxicab (%)
Means of transportation to work - Motorcycle (%)
Means of transportation to work - Bicycle (%)
Means of transportation to work - Walked (%)
Means of transportation to work - Other means (%)
Working at home (%)
Industry diversity
Most Common Industries - Agriculture, forestry, fishing and hunting, and mining (%)
Most Common Industries - Agriculture, forestry, fishing and hunting (%)
Most Common Industries - Mining, quarrying, and oil and gas extraction (%)
Most Common Industries - Construction (%)
Most Common Industries - Manufacturing (%)
Most Common Industries - Wholesale trade (%)
Most Common Industries - Retail trade (%)
Most Common Industries - Transportation and warehousing, and utilities (%)
Most Common Industries - Transportation and warehousing (%)
Most Common Industries - Utilities (%)
Most Common Industries - Information (%)
Most Common Industries - Finance and insurance, and real estate and rental and leasing (%)
Most Common Industries - Finance and insurance (%)
Most Common Industries - Real estate and rental and leasing (%)
Most Common Industries - Professional, scientific, and management, and administrative and waste management services (%)
Most Common Industries - Professional, scientific, and technical services (%)
Most Common Industries - Management of companies and enterprises (%)
Most Common Industries - Administrative and support and waste management services (%)
Most Common Industries - Educational services, and health care and social assistance (%)
Most Common Industries - Educational services (%)
Most Common Industries - Health care and social assistance (%)
Most Common Industries - Arts, entertainment, and recreation, and accommodation and food services (%)
Most Common Industries - Arts, entertainment, and recreation (%)
Most Common Industries - Accommodation and food services (%)
Most Common Industries - Other services, except public administration (%)
Most Common Industries - Public administration (%)
Occupation diversity
Most Common Occupations - Management, business, science, and arts occupations (%)
Most Common Occupations - Management, business, and financial occupations (%)
Most Common Occupations - Management occupations (%)
Most Common Occupations - Business and financial operations occupations (%)
Most Common Occupations - Computer, engineering, and science occupations (%)
Most Common Occupations - Computer and mathematical occupations (%)
Most Common Occupations - Architecture and engineering occupations (%)
Most Common Occupations - Life, physical, and social science occupations (%)
Most Common Occupations - Education, legal, community service, arts, and media occupations (%)
Most Common Occupations - Community and social service occupations (%)
Most Common Occupations - Legal occupations (%)
Most Common Occupations - Education, training, and library occupations (%)
Most Common Occupations - Arts, design, entertainment, sports, and media occupations (%)
Most Common Occupations - Healthcare practitioners and technical occupations (%)
Most Common Occupations - Health diagnosing and treating practitioners and other technical occupations (%)
Most Common Occupations - Health technologists and technicians (%)
Most Common Occupations - Service occupations (%)
Most Common Occupations - Healthcare support occupations (%)
Most Common Occupations - Protective service occupations (%)
Most Common Occupations - Fire fighting and prevention, and other protective service workers including supervisors (%)
Most Common Occupations - Law enforcement workers including supervisors (%)
Most Common Occupations - Food preparation and serving related occupations (%)
Most Common Occupations - Building and grounds cleaning and maintenance occupations (%)
Most Common Occupations - Personal care and service occupations (%)
Most Common Occupations - Sales and office occupations (%)
Most Common Occupations - Sales and related occupations (%)
Most Common Occupations - Office and administrative support occupations (%)
Most Common Occupations - Natural resources, construction, and maintenance occupations (%)
Most Common Occupations - Farming, fishing, and forestry occupations (%)
Most Common Occupations - Construction and extraction occupations (%)
Most Common Occupations - Installation, maintenance, and repair occupations (%)
Most Common Occupations - Production, transportation, and material moving occupations (%)
Most Common Occupations - Production occupations (%)
Most Common Occupations - Transportation occupations (%)
Most Common Occupations - Material moving occupations (%)
People in Group quarters - Institutionalized population (%)
People in Group quarters - Correctional institutions (%)
People in Group quarters - Federal prisons and detention centers (%)
People in Group quarters - Halfway houses (%)
People in Group quarters - Local jails and other confinement facilities (including police lockups) (%)
People in Group quarters - Military disciplinary barracks (%)
People in Group quarters - State prisons (%)
People in Group quarters - Other types of correctional institutions (%)
People in Group quarters - Nursing homes (%)
People in Group quarters - Hospitals/wards, hospices, and schools for the handicapped (%)
People in Group quarters - Hospitals/wards and hospices for chronically ill (%)
People in Group quarters - Hospices or homes for chronically ill (%)
People in Group quarters - Military hospitals or wards for chronically ill (%)
People in Group quarters - Other hospitals or wards for chronically ill (%)
People in Group quarters - Hospitals or wards for drug/alcohol abuse (%)
People in Group quarters - Mental (Psychiatric) hospitals or wards (%)
People in Group quarters - Schools, hospitals, or wards for the mentally retarded (%)
People in Group quarters - Schools, hospitals, or wards for the physically handicapped (%)
People in Group quarters - Institutions for the deaf (%)
People in Group quarters - Institutions for the blind (%)
People in Group quarters - Orthopedic wards and institutions for the physically handicapped (%)
People in Group quarters - Wards in general hospitals for patients who have no usual home elsewhere (%)
People in Group quarters - Wards in military hospitals for patients who have no usual home elsewhere (%)
People in Group quarters - Juvenile institutions (%)
People in Group quarters - Long-term care (%)
People in Group quarters - Homes for abused, dependent, and neglected children (%)
People in Group quarters - Residential treatment centers for emotionally disturbed children (%)
People in Group quarters - Training schools for juvenile delinquents (%)
People in Group quarters - Short-term care, detention or diagnostic centers for delinquent children (%)
People in Group quarters - Type of juvenile institution unknown (%)
People in Group quarters - Noninstitutionalized population (%)
People in Group quarters - College dormitories (includes college quarters off campus) (%)
People in Group quarters - Military quarters (%)
People in Group quarters - On base (%)
People in Group quarters - Barracks, unaccompanied personnel housing (UPH), (Enlisted/Officer), ;and similar group living quarters for military personnel (%)
People in Group quarters - Transient quarters for temporary residents (%)
People in Group quarters - Military ships (%)
People in Group quarters - Group homes (%)
People in Group quarters - Homes or halfway houses for drug/alcohol abuse (%)
People in Group quarters - Homes for the mentally ill (%)
People in Group quarters - Homes for the mentally retarded (%)
People in Group quarters - Homes for the physically handicapped (%)
People in Group quarters - Other group homes (%)
People in Group quarters - Religious group quarters (%)
People in Group quarters - Dormitories (%)
People in Group quarters - Agriculture workers' dormitories on farms (%)
People in Group quarters - Job Corps and vocational training facilities (%)
People in Group quarters - Other workers' dormitories (%)
People in Group quarters - Crews of maritime vessels (%)
People in Group quarters - Other nonhousehold living situations (%)
People in Group quarters - Other noninstitutional group quarters (%)
Residents speaking English at home (%)
Residents speaking English at home - Born in the United States (%)
Residents speaking English at home - Native, born elsewhere (%)
Residents speaking English at home - Foreign born (%)
Residents speaking Spanish at home (%)
Residents speaking Spanish at home - Born in the United States (%)
Residents speaking Spanish at home - Native, born elsewhere (%)
Residents speaking Spanish at home - Foreign born (%)
Residents speaking other language at home (%)
Residents speaking other language at home - Born in the United States (%)
Residents speaking other language at home - Native, born elsewhere (%)
Residents speaking other language at home - Foreign born (%)
Class of Workers - Employee of private company (%)
Class of Workers - Self-employed in own incorporated business (%)
Class of Workers - Private not-for-profit wage and salary workers (%)
Class of Workers - Local government workers (%)
Class of Workers - State government workers (%)
Class of Workers - Federal government workers (%)
Class of Workers - Self-employed workers in own not incorporated business and Unpaid family workers (%)
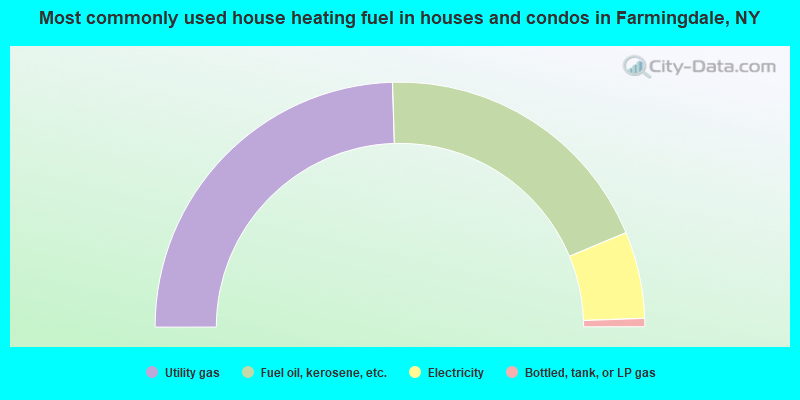
House heating fuel used in houses and condos - Utility gas (%)
House heating fuel used in houses and condos - Bottled, tank, or LP gas (%)
House heating fuel used in houses and condos - Electricity (%)
House heating fuel used in houses and condos - Fuel oil, kerosene, etc. (%)
House heating fuel used in houses and condos - Coal or coke (%)
House heating fuel used in houses and condos - Wood (%)
House heating fuel used in houses and condos - Solar energy (%)
House heating fuel used in houses and condos - Other fuel (%)
House heating fuel used in houses and condos - No fuel used (%)
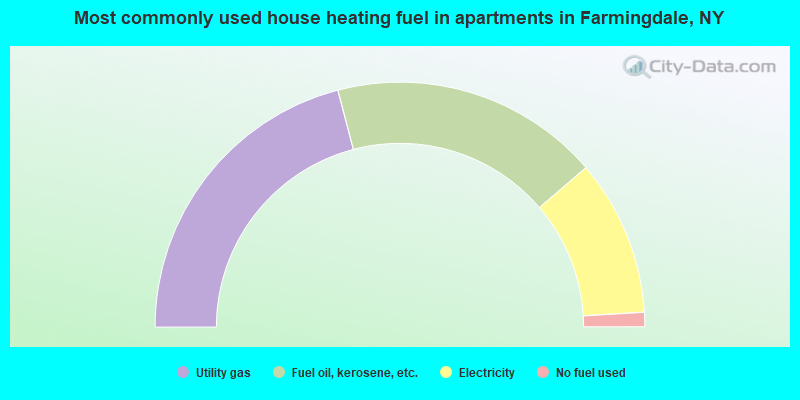
House heating fuel used in apartments - Utility gas (%)
House heating fuel used in apartments - Bottled, tank, or LP gas (%)
House heating fuel used in apartments - Electricity (%)
House heating fuel used in apartments - Fuel oil, kerosene, etc. (%)
House heating fuel used in apartments - Coal or coke (%)
House heating fuel used in apartments - Wood (%)
House heating fuel used in apartments - Solar energy (%)
House heating fuel used in apartments - Other fuel (%)
House heating fuel used in apartments - No fuel used (%)
Armed forces status - In Armed Forces (%)
Armed forces status - Civilian (%)
Armed forces status - Civilian - Veteran (%)
Armed forces status - Civilian - Nonveteran (%)
Fatal accidents locations in years 2005-2021
Fatal accidents locations in 2005
Fatal accidents locations in 2006
Fatal accidents locations in 2007
Fatal accidents locations in 2008
Fatal accidents locations in 2009
Fatal accidents locations in 2010
Fatal accidents locations in 2011
Fatal accidents locations in 2012
Fatal accidents locations in 2013
Fatal accidents locations in 2014
Fatal accidents locations in 2015
Fatal accidents locations in 2016
Fatal accidents locations in 2017
Fatal accidents locations in 2018
Fatal accidents locations in 2019
Fatal accidents locations in 2020
Fatal accidents locations in 2021
Alcohol use - People drinking some alcohol every month (%)
Alcohol use - People not drinking at all (%)
Alcohol use - Average days/month drinking alcohol
Alcohol use - Average drinks/week
Alcohol use - Average days/year people drink much
Audiometry - Average condition of hearing (%)
Audiometry - People that can hear a whisper from across a quiet room (%)
Audiometry - People that can hear normal voice from across a quiet room (%)
Audiometry - Ears ringing, roaring, buzzing (%)
Audiometry - Had a job exposure to loud noise (%)
Audiometry - Had off-work exposure to loud noise (%)
Blood Pressure & Cholesterol - Has high blood pressure (%)
Blood Pressure & Cholesterol - Checking blood pressure at home (%)
Blood Pressure & Cholesterol - Frequently checking blood cholesterol (%)
Blood Pressure & Cholesterol - Has high cholesterol level (%)
Consumer Behavior - Money monthly spent on food at supermarket/grocery store
Consumer Behavior - Money monthly spent on food at other stores
Consumer Behavior - Money monthly spent on eating out
Consumer Behavior - Money monthly spent on carryout/delivered foods
Consumer Behavior - Income spent on food at supermarket/grocery store (%)
Consumer Behavior - Income spent on food at other stores (%)
Consumer Behavior - Income spent on eating out (%)
Consumer Behavior - Income spent on carryout/delivered foods (%)
Current Health Status - General health condition (%)
Current Health Status - Blood donors (%)
Current Health Status - Has blood ever tested for HIV virus (%)
Current Health Status - Left-handed people (%)
Dermatology - People using sunscreen (%)
Diabetes - Diabetics (%)
Diabetes - Had a blood test for high blood sugar (%)
Diabetes - People taking insulin (%)
Diet Behavior & Nutrition - Diet health (%)
Diet Behavior & Nutrition - Milk product consumption (# of products/month)
Diet Behavior & Nutrition - Meals not home prepared (#/week)
Diet Behavior & Nutrition - Meals from fast food or pizza place (#/week)
Diet Behavior & Nutrition - Ready-to-eat foods (#/month)
Diet Behavior & Nutrition - Frozen meals/pizza (#/month)
Drug Use - People that ever used marijuana or hashish (%)
Drug Use - Ever used hard drugs (%)
Drug Use - Ever used any form of cocaine (%)
Drug Use - Ever used heroin (%)
Drug Use - Ever used methamphetamine (%)
Health Insurance - People covered by health insurance (%)
Kidney Conditions-Urology - Avg. # of times urinating at night
Medical Conditions - People with asthma (%)
Medical Conditions - People with anemia (%)
Medical Conditions - People with psoriasis (%)
Medical Conditions - People with overweight (%)
Medical Conditions - Elderly people having difficulties in thinking or remembering (%)
Medical Conditions - People who ever received blood transfusion (%)
Medical Conditions - People having trouble seeing even with glass/contacts (%)
Medical Conditions - People with arthritis (%)
Medical Conditions - People with gout (%)
Medical Conditions - People with congestive heart failure (%)
Medical Conditions - People with coronary heart disease (%)
Medical Conditions - People with angina pectoris (%)
Medical Conditions - People who ever had heart attack (%)
Medical Conditions - People who ever had stroke (%)
Medical Conditions - People with emphysema (%)
Medical Conditions - People with thyroid problem (%)
Medical Conditions - People with chronic bronchitis (%)
Medical Conditions - People with any liver condition (%)
Medical Conditions - People who ever had cancer or malignancy (%)
Mental Health - People who have little interest in doing things (%)
Mental Health - People feeling down, depressed, or hopeless (%)
Mental Health - People who have trouble sleeping or sleeping too much (%)
Mental Health - People feeling tired or having little energy (%)
Mental Health - People with poor appetite or overeating (%)
Mental Health - People feeling bad about themself (%)
Mental Health - People who have trouble concentrating on things (%)
Mental Health - People moving or speaking slowly or too fast (%)
Mental Health - People having thoughts they would be better off dead (%)
Oral Health - Average years since last visit a dentist
Oral Health - People embarrassed because of mouth (%)
Oral Health - People with gum disease (%)
Oral Health - General health of teeth and gums (%)
Oral Health - Average days a week using dental floss/device
Oral Health - Average days a week using mouthwash for dental problem
Oral Health - Average number of teeth
Pesticide Use - Households using pesticides to control insects (%)
Pesticide Use - Households using pesticides to kill weeds (%)
Physical Activity - People doing vigorous-intensity work activities (%)
Physical Activity - People doing moderate-intensity work activities (%)
Physical Activity - People walking or bicycling (%)
Physical Activity - People doing vigorous-intensity recreational activities (%)
Physical Activity - People doing moderate-intensity recreational activities (%)
Physical Activity - Average hours a day doing sedentary activities
Physical Activity - Average hours a day watching TV or videos
Physical Activity - Average hours a day using computer
Physical Functioning - People having limitations keeping them from working (%)
Physical Functioning - People limited in amount of work they can do (%)
Physical Functioning - People that need special equipment to walk (%)
Physical Functioning - People experiencing confusion/memory problems (%)
Physical Functioning - People requiring special healthcare equipment (%)
Prescription Medications - Average number of prescription medicines taking
Preventive Aspirin Use - Adults 40+ taking low-dose aspirin (%)
Reproductive Health - Vaginal deliveries (%)
Reproductive Health - Cesarean deliveries (%)
Reproductive Health - Deliveries resulted in a live birth (%)
Reproductive Health - Pregnancies resulted in a delivery (%)
Reproductive Health - Women breastfeeding newborns (%)
Reproductive Health - Women that had a hysterectomy (%)
Reproductive Health - Women that had both ovaries removed (%)
Reproductive Health - Women that have ever taken birth control pills (%)
Reproductive Health - Women taking birth control pills (%)
Reproductive Health - Women that have ever used Depo-Provera or injectables (%)
Reproductive Health - Women that have ever used female hormones (%)
Sexual Behavior - People 18+ that ever had sex (vaginal, anal, or oral) (%)
Sexual Behavior - Males 18+ that ever had vaginal sex with a woman (%)
Sexual Behavior - Males 18+ that ever performed oral sex on a woman (%)
Sexual Behavior - Males 18+ that ever had anal sex with a woman (%)
Sexual Behavior - Males 18+ that ever had any sex with a man (%)
Sexual Behavior - Females 18+ that ever had vaginal sex with a man (%)
Sexual Behavior - Females 18+ that ever performed oral sex on a man (%)
Sexual Behavior - Females 18+ that ever had anal sex with a man (%)
Sexual Behavior - Females 18+ that ever had any kind of sex with a woman (%)
Sexual Behavior - Average age people first had sex
Sexual Behavior - Average number of female sex partners in lifetime (males 18+)
Sexual Behavior - Average number of female vaginal sex partners in lifetime (males 18+)
Sexual Behavior - Average age people first performed oral sex on a woman (18+)
Sexual Behavior - Average number of woman performed oral sex on in lifetime (18+)
Sexual Behavior - Average number of male sex partners in lifetime (males 18+)
Sexual Behavior - Average number of male anal sex partners in lifetime (males 18+)
Sexual Behavior - Average age people first performed oral sex on a man (18+)
Sexual Behavior - Average number of male oral sex partners in lifetime (18+)
Sexual Behavior - People using protection when performing oral sex (%)
Sexual Behavior - Average number of times people have vaginal or anal sex a year
Sexual Behavior - People having sex without condom (%)
Sexual Behavior - Average number of male sex partners in lifetime (females 18+)
Sexual Behavior - Average number of male vaginal sex partners in lifetime (females 18+)
Sexual Behavior - Average number of female sex partners in lifetime (females 18+)
Sexual Behavior - Circumcised males 18+ (%)
Sleep Disorders - Average hours sleeping at night
Sleep Disorders - People that has trouble sleeping (%)
Smoking-Cigarette Use - People smoking cigarettes (%)
Taste & Smell - People 40+ having problems with smell (%)
Taste & Smell - People 40+ having problems with taste (%)
Taste & Smell - People 40+ that ever had wisdom teeth removed (%)
Taste & Smell - People 40+ that ever had tonsils teeth removed (%)
Taste & Smell - People 40+ that ever had a loss of consciousness because of a head injury (%)
Taste & Smell - People 40+ that ever had a broken nose or other serious injury to face or skull (%)
Taste & Smell - People 40+ that ever had two or more sinus infections (%)
Weight - Average height (inches)
Weight - Average weight (pounds)
Weight - Average BMI
Weight - People that are obese (%)
Weight - People that ever were obese (%)
Weight - People trying to lose weight (%)
According to our research of New York and other state lists, there were 6 registered sex offenders living in Farmingdale, New York as of May 21, 2024 . The ratio of all residents to sex offenders in Farmingdale is 1,427 to 1.The ratio of registered sex offenders to all residents in this city is lower than the state average.
Latest news from Farmingdale, NY collected exclusively by city-data.com from local newspapers, TV, and radio stations
Farmingdale, NY City Guides: Ancestries: Italian (23.1%), Irish (5.8%), Russian (5.5%), Haitian (5.3%), German (5.3%), American (3.5%).
Current Local Time:
Land area: 1.13 square miles.
Population density: 7,406 people per square mile (high).
1,091 residents are foreign born (6.4% Latin America , 5.2% Asia , 1.4% Europe ).
This village:
13.0%New York:
22.6%
Median real estate property taxes paid for housing units with mortgages in 2022: $10,001 (1.8%)Median real estate property taxes paid for housing units with no mortgage in 2022: $9,468 (2.0%)
Nearest city with pop. 50,000+: Levittown, NY
Nearest city with pop. 200,000+: North Hempstead, NY
Nearest city with pop. 1,000,000+: Queens, NY
Nearest cities:
Latitude: 40.73 N, Longitude: 73.45 W
Daytime population change due to commuting: -349 (-4.2%)Workers who live and work in this village: 574 (12.1%)
Farmingdale tourist attractions:
Single-family new house construction building permits:
2022: 1 building , cost: $450,0002020: 1 building , cost: $358,0002019: 3 buildings , average cost: $425,0002018: 4 buildings , average cost: $50,0002016: 25 buildings , average cost: $165,2002012: 1 building , cost: $200,0002007: 12 buildings , average cost: $179,2002006: 17 buildings , average cost: $175,1002005: 21 buildings , average cost: $182,0002004: 15 buildings , average cost: $142,9002003: 8 buildings , average cost: $125,0002002: 6 buildings , average cost: $94,2002001: 8 buildings , average cost: $86,3002000: 3 buildings , average cost: $100,0001999: 11 buildings , average cost: $81,8001998: 2 buildings , average cost: $117,0001997: 7 buildings , average cost: $84,900Unemployment in December 2023:
Population change in the 1990s: +109 (+1.3%).
Most common occupations in Farmingdale, NY (%)
Both Males Females
Other office and administrative support workers, including supervisors (5.8%)
Computer specialists (4.1%)
Other sales and related occupations, including supervisors (4.0%)
Building and grounds cleaning and maintenance occupations (3.9%)
Other production occupations, including supervisors (3.8%)
Secretaries and administrative assistants (3.8%)
Retail sales workers, except cashiers (3.3%)
Computer specialists (6.1%)
Building and grounds cleaning and maintenance occupations (5.5%)
Electrical equipment mechanics and other installation, maintenance, and repair workers, including supervisors (4.7%)
Other sales and related occupations, including supervisors (4.6%)
Other production occupations, including supervisors (4.1%)
Other management occupations, except farmers and farm managers (4.0%)
Material recording, scheduling, dispatching, and distributing workers (3.8%)
Other office and administrative support workers, including supervisors (9.2%)
Secretaries and administrative assistants (8.4%)
Preschool, kindergarten, elementary, and middle school teachers (5.1%)
Retail sales workers, except cashiers (4.6%)
Financial clerks, except bookkeeping, accounting and auditing clerks (4.1%)
Information and record clerks, except customer service representatives (3.9%)
Health technologists and technicians (3.8%)
Tornado activity:
Farmingdale-area historical tornado activity is slightly above New York state average. It is 55% smaller than the overall U.S. average.
On 7/10/1989, a category F4 (max. wind speeds 207-260 mph) tornado 49.0 miles away from the Farmingdale village center injured 40 people and caused between $50,000,000 and $500,000,000 in damages.
On 9/27/1970, a category F2 (max. wind speeds 113-157 mph) tornado 3.7 miles away from the village center caused between $50,000 and $500,000 in damages.
Earthquake activity:
Farmingdale-area historical earthquake activity is significantly above New York state average. It is 70% smaller than the overall U.S. average. On 8/23/2011 at 17:51:04, a magnitude 5.8 (5.8 MW, Depth: 3.7 mi, Class: Moderate, Intensity: VI - VII) earthquake occurred 309.6 miles away from the city center On 10/7/1983 at 10:18:46, a magnitude 5.3 (5.1 MB, 5.3 LG, 5.1 ML) earthquake occurred 227.4 miles away from Farmingdale center On 4/20/2002 at 10:50:47, a magnitude 5.3 (5.3 ML, Depth: 3.0 mi) earthquake occurred 261.7 miles away from Farmingdale center On 1/16/1994 at 01:49:16, a magnitude 4.6 (4.6 MB, 4.6 LG, Depth: 3.1 mi, Class: Light, Intensity: IV - V) earthquake occurred 139.1 miles away from Farmingdale center On 4/20/2002 at 10:50:47, a magnitude 5.2 (5.2 MB, 4.2 MS, 5.2 MW, 5.0 MW) earthquake occurred 260.0 miles away from Farmingdale center On 8/22/1992 at 12:20:32, a magnitude 4.8 (4.8 MB, 3.8 MS, 4.7 LG, Depth: 6.2 mi) earthquake occurred 200.4 miles away from the city center Magnitude types: regional Lg-wave magnitude (LG), body-wave magnitude (MB), local magnitude (ML), surface-wave magnitude (MS), moment magnitude (MW) Natural disasters: The number of natural disasters in Nassau County (25) is a lot greater than the US average (15).Major Disasters (Presidential) Declared: 17Emergencies Declared: 7Hurricanes: 8, Storms: 7, Floods: 6, Blizzards: 2, Snowstorms: 2, Heavy Rain: 1, Power Outage: 1, Tropical Depression: 1, Tropical Storm: 1, Water Shortage: 1, Winter Storm: 1, Other: 3 (Note: some incidents may be assigned to more than one category). Main business address for: MISONIX INC LABORATORY APPARATUS & FURNITURE ), P&F INDUSTRIES INC METALWORKING MACHINERY & EQUIPMENT ), DEL LABORATORIES INC PERFUMES, COSMETICS & OTHER TOILET PREPARATIONS ), ENZO BIOCHEM INC SERVICES-MEDICAL LABORATORIES ).
Hospitals and medical centers in Farmingdale: THE CENTER FOR DEVELOPMENTAL DISABILITIES, INC (80 ELM DRIVE) DALEVIEW MANOR HRF (530 FULTON ST)
Other hospitals and medical centers near Farmingdale: DALEVIEW CARE CENTER (Nursing Home, about 1 miles away; EAST FARMINGDALE, NY)
ST JOSEPH HOSPITAL (about 2 miles away; BETHPAGE, NY)
WINTHROP UNIVERSITY HOSPITAL (Dialysis Facility, about 3 miles away; BETHPAGE, NY)
LONG ISLAND RENAL CARE, INC. (Dialysis Facility, about 3 miles away; NORTH AMITYVILLE, NY)
MELVILLE SURGICAL CENTER (Hospital, about 3 miles away; MELVILLE, NY)
MASSAPEQUA GENERAL HOSPITAL (Hospital, about 3 miles away; SEAFORD, NY)
CENTRAL ISLAND HEALTHCARE (Nursing Home, about 4 miles away; PLAINVIEW, NY)
Amtrak station near Farmingdale: 19 miles: KENNEDY AIRPORT NEW YORK (QUEENS, ) - Bus Station Services: enclosed waiting area, public restrooms, public payphones, snack bar and vending machines, ATM, paid short-term parking, paid long-term parking, car rental agency, taxi stand.
College/University in Farmingdale: Farmingdale State College Full-time enrollment: 6,956; Location: 2350 Broadhollow Road; Public; Website: WWW.FARMINGDALE.EDU)
Other colleges/universities with over 2000 students near Farmingdale:
Briarcliffe College (about 4 miles; Bethpage, NY ; Full-time enrollment: 2,134)
Nassau Community College (about 8 miles; Garden City, NY ; FT enrollment: 18,552)
SUNY College at Old Westbury (about 8 miles; Old Westbury, NY ; FT enrollment: 4,096)
Hofstra University (about 9 miles; Hempstead, NY ; FT enrollment: 9,429)
LIU Post (about 10 miles; Brookville, NY ; FT enrollment: 6,854)
Molloy College (about 11 miles; Rockville Centre, NY ; FT enrollment: 3,962)
New York Institute of Technology (about 11 miles; Old Westbury, NY ; FT enrollment: 5,745)
Public high school in Farmingdale:
Private high school in Farmingdale:
Public elementary/middle schools in Farmingdale:
Private elementary/middle school in Farmingdale:
See full list of schools located in Farmingdale Library in Farmingdale: FARMINGDALE PUBLIC LIBRARY Operating income: $3,603,131; Location: 116 MERRITTS ROAD; 210,472 books ; 320 e-books ; 7,417 audio materials ; 11,216 video materials ; 64 local licensed databases ; 14 state licensed databases ; 3 other licensed databases ; 289 print serial subscriptions ; 4 electronic serial subscriptions )
Notable locations in Farmingdale: (A) , Farmingdale Village Hall (B) , Farmingdale Fire Department (C) . Display/hide their locations on the map
Churches in Farmingdale include: (A) , Farmingdale Christian Church (B) , Key to Faith Ministries (C) , Saint Thomas Episcopal Church (D) , Saint Luke's Lutheran Church (E) , Saint Kilian Roman Catholic Church (F) , Farmingdale United Methodist Church (G) . Display/hide their locations on the map
Tourist attractions:
Hotel:
Court:
Birthplace of: Jed Davis - Singer, Al Brosch - Professional golfer, Matt Danowski - Lacrosse player, Paul Furio - Singer-songwriter, Chris Coffey - College basketball player (Northeastern Huskies), Gregory W. Carman - Politician, Jack Lamabe - Baseball player.
Nassau County has a predicted average indoor radon screening level less than 2 pCi/L (pico curies per liter) - Low Potential Drinking water stations with addresses in Farmingdale and their reported violations in the past:
WENDYS OLD FASHIONED HAMBURGER (Address: SUITE 115 Serves NJ, Population served: 258, Groundwater):
Past monitoring violations:
Monitoring, Source Water (GWR) - In JUL-2010, Contaminant: E. COLI. Follow-up actions: St Formal NOV issued (JAN-13-2011), St Public Notif requested (JAN-13-2011)
One routine major monitoring violation
One minor monitoring violation
2 regular monitoring violations
Average household size: This village:
2.4 peopleNew York:
2.6 people
Percentage of family households: This village:
60.2%Whole state:
63.5%
Percentage of households with unmarried partners: This village:
6.1%Whole state:
6.8%
Likely homosexual households (counted as self-reported same-sex unmarried-partner households)
Lesbian couples: 0.3% of all households Gay men: 0.5% of all households
People in group quarters in Farmingdale in 2010:
127 people in nursing facilities/skilled-nursing facilities
13 people in emergency and transitional shelters (with sleeping facilities) for people experiencing homelessness
13 people in group homes intended for adults
7 people in residential treatment centers for adults
5 people in other noninstitutional facilities
People in group quarters in Farmingdale in 2000:
136 people in nursing homes
19 people in homes for the mentally ill
13 people in homes for the mentally retarded
10 people in homes for the physically handicapped
5 people in religious group quarters
Banks with most branches in Farmingdale (2011 data):
Citibank, National Association: Farmingdale Branch, Farmingdale Drive-Up Branch, East Farmingdale Branch. Info updated 2012/01/10: Bank assets: $1,288,658.0 mil, Deposits: $882,541.0 mil, headquarters in Sioux Falls, SD, positive income , International Specialization, 1048 total offices , Holding Company: Citigroup Inc.
TD Bank, National Association: Farmingdale Ii Branch at 90 Broadhollow Road, branch established on 2009/12/19; Farmingdale Branch at 2025 Broadhollow Road, branch established on 2005/10/22. Info updated 2010/10/04: Bank assets: $188,912.6 mil, Deposits: $153,149.8 mil, headquarters in Wilmington, DE, positive income , 1314 total offices , Holding Company: Toronto-Dominion Bank, The
Capital One, National Association: East Farmingdale Branch at 1995 New Hwy, branch established on 2008/08/25; Farmingdale Branch at 312 Conklin Street, branch established on 1934/01/01. Info updated 2011/07/01: Bank assets: $133,477.8 mil, Deposits: $97,063.7 mil, headquarters in Mclean, VA, positive income , 984 total offices , Holding Company: Capital One Financial Corporation
The First National Bank of Long Island: New Highway Branch at 2091 New Highway, branch established on 2000/11/22; Allen Boulevard Branch at 22 Allen Boulevard, branch established on 2000/12/04. Info updated 2006/07/13: Bank assets: $2,021.9 mil, Deposits: $1,503.5 mil, headquarters in Glen Head, NY, positive income , Mortgage Lending Specialization, 34 total offices , Holding Company: First Of Long Island Corporation, The
Valley National Bank: Farmingdale Branch at 27 Smith Street, branch established on 1997/12/30. Info updated 2012/01/10: Bank assets: $14,186.7 mil, Deposits: $9,715.7 mil, headquarters in Wayne, NJ, positive income , Commercial Lending Specialization, 219 total offices , Holding Company: Valley National Bancorp
JPMorgan Chase Bank, National Association: Farmingdale Banking Center Branch at 334 Main Street, branch established on 2005/10/24. Info updated 2011/11/10: Bank assets: $1,811,678.0 mil, Deposits: $1,190,738.0 mil, headquarters in Columbus, OH, positive income , International Specialization, 5577 total offices , Holding Company: Jpmorgan Chase & Co.
Bank of America, National Association: Farmingdale_ Rte 110 at 927 Route 110, branch established on 2008/06/02. Info updated 2009/11/18: Bank assets: $1,451,969.3 mil, Deposits: $1,077,176.8 mil, headquarters in Charlotte, NC, positive income , 5782 total offices , Holding Company: Bank Of America Corporation
New York Community Bank: Farmingdale Branch at 14 Conklin Street, branch established on 1968/12/14. Info updated 2010/03/29: Bank assets: $39,468.7 mil, Deposits: $20,709.8 mil, headquarters in Westbury, NY, positive income , Commercial Lending Specialization, 247 total offices , Holding Company: New York Community Bancorp, Inc.
RBS Citizens, National Association: Farmingdale Stop & Shop at 55 Motor Avenue, branch established on 2010/05/14. Info updated 2007/09/19: Bank assets: $106,940.6 mil, Deposits: $75,690.2 mil, headquarters in Providence, RI, positive income , 1135 total offices , Holding Company: Uk Financial Investments Limited
For population 15 years and over in Farmingdale:
Never married: 30.6%Now married: 46.7%Separated: 2.7%Widowed: 7.2%Divorced: 12.7% For population 25 years and over in Farmingdale:
High school or higher: 94.8%Bachelor's degree or higher: 50.4%Graduate or professional degree: 19.8%Unemployed: 3.7%Mean travel time to work (commute): 29.1 minutes
Education Gini index (Inequality in education) Here:
11.6New York average:
13.9
Religion statistics for Farmingdale, NY (based on Nassau County data)
Religion Adherents Congregations Catholic 677,149 73 Other 102,012 168 Mainline Protestant 50,181 184 Evangelical Protestant 39,923 251 Orthodox 16,758 22 Black Protestant 13,189 45 None 440,320 -
Source: Clifford Grammich, Kirk Hadaway, Richard Houseal, Dale E.Jones, Alexei Krindatch, Richie Stanley and Richard H.Taylor. 2012. 2010 U.S.Religion Census: Religious Congregations & Membership Study. Association of Statisticians of American Religious Bodies. Jones, Dale E., et al. 2002. Congregations and Membership in the United States 2000. Nashville, TN: Glenmary Research Center. Graphs represent county-level data
Food Environment Statistics: Number of grocery stores : 556This county :
4.11 / 10,000 pop.State :
4.13 / 10,000 pop.
Number of supercenters and club stores : 7Nassau County :
0.05 / 10,000 pop.New York :
0.06 / 10,000 pop.
Number of convenience stores (no gas) : 201This county :
1.49 / 10,000 pop.New York :
0.92 / 10,000 pop.
Number of convenience stores (with gas) : 174This county :
1.29 / 10,000 pop.State :
1.68 / 10,000 pop.
Number of full-service restaurants : 1,219Here :
9.01 / 10,000 pop.New York :
8.82 / 10,000 pop.
Adult diabetes rate : Nassau County :
8.3%New York :
8.2%
Adult obesity rate : This county :
20.9%New York :
23.8%
Low-income preschool obesity rate : Nassau County :
22.2%State :
15.6%
Health and Nutrition: Healthy diet rate : This city:
52.1%New York:
50.1%
Average overall health of teeth and gums : This city:
50.9%State:
48.1%
Average BMI : This city:
28.2New York:
28.5
People feeling badly about themselves : This city:
19.4%New York:
20.3%
People not drinking alcohol at all : Average hours sleeping at night : Farmingdale:
6.9New York:
6.8
Overweight people : Farmingdale:
32.5%State:
33.4%
General health condition : Farmingdale:
59.1%New York:
56.5%
Average condition of hearing : Farmingdale:
80.2%State:
80.2%
More about Health and Nutrition of Farmingdale, NY Residents
Local government employment and payroll (March 2022)
Function
Full-time employees
Monthly full-time payroll
Average yearly full-time wage
Part-time employees
Monthly part-time payroll
Streets and Highways
9 $50,990 $67,987 5 $10,011 Solid Waste Management
8 $39,593 $59,390 3 $3,628 Financial Administration
7 $43,492 $74,558 0 $0 Water Supply
3 $21,848 $87,392 0 $0 Other and Unallocable
2 $10,805 $64,830 7 $7,336 Judicial and Legal
1 $4,048 $48,576 4 $9,021 Firefighters
1 $5,507 $66,084 8 $16,306 Other Government Administration
0 $0 6 $5,500
Totals for Government
31 $176,284 $68,239 33 $51,802
Farmingdale government finances - Expenditure in 2017 (per resident):
Construction - Regular Highways: $3,467,000 ($414.27)
Current Operations - General - Other: $1,801,000 ($215.20)
Water Utilities: $1,083,000 ($129.41)Regular Highways: $714,000 ($85.31)Financial Administration: $452,000 ($54.01)Local Fire Protection: $394,000 ($47.08)Judicial and Legal Services: $226,000 ($27.00)Parks and Recreation: $124,000 ($14.82)Parking Facilities: $119,000 ($14.22)General Public Buildings: $111,000 ($13.26)Solid Waste Management: $106,000 ($12.67)Protective Inspection and Regulation - Other: $90,000 ($10.75)Central Staff Services: $76,000 ($9.08)General - Interest on Debt: $384,000 ($45.88)
Other Capital Outlay - Housing and Community Development: $541,000 ($64.64)
Regular Highways: $278,000 ($33.22)Local Fire Protection: $43,000 ($5.14)Total Salaries and Wages: $1,716,000 ($205.04)
Farmingdale government finances - Revenue in 2017 (per resident):
Charges - Parking Facilities: $290,000 ($34.65)
Other: $116,000 ($13.86)Federal Intergovernmental - Housing and Community Development: $511,000 ($61.06)
Local Intergovernmental - Other: $87,000 ($10.40)
General Local Government Support: $23,000 ($2.75)Miscellaneous - Fines and Forfeits: $398,000 ($47.56)
Rents: $193,000 ($23.06)General Revenue - Other: $170,000 ($20.31)Interest Earnings: $17,000 ($2.03)Revenue - Water Utilities: $1,322,000 ($157.96)
State Intergovernmental - General Local Government Support: $78,000 ($9.32)
Other: $3,000 ($0.36)Tax - Property: $3,637,000 ($434.58)
Other License: $420,000 ($50.19)Public Utilities Sales: $418,000 ($49.95)Occupation and Business License - Other: $278,000 ($33.22)
Farmingdale government finances - Debt in 2017 (per resident):
Long Term Debt - Outstanding Unspecified Public Purpose: $7,575,000 ($905.13)
Issue, Unspecified Public Purpose: $4,750,000 ($567.57)Beginning Outstanding - Unspecified Public Purpose: $4,185,000 ($500.06)Retired Unspecified Public Purpose: $1,360,000 ($162.50)Short Term Debt Outstanding - Beginning: $1,850,000 ($221.05)
End of Fiscal Year: $1,000,000 ($119.49)
Farmingdale government finances - Cash and Securities in 2017 (per resident):
Bond Funds - Cash and Securities: $1,642,000 ($196.20)
Other Funds - Cash and Securities: $4,655,000 ($556.22)
4.70% of this county's 2021 resident taxpayers lived in other counties in 2020 ($121,726 average adjusted gross income )
Here:
4.70%New York average:
5.29%
0.01% of residents moved from foreign countries ($55 average AGI )Nassau County:
0.01%New York average:
0.01%
Top counties from which taxpayers relocated into this county between 2020 and 2021:
5.44% of this county's 2020 resident taxpayers moved to other counties in 2021 ($120,429 average adjusted gross income )
Here:
5.44%New York average:
6.93%
0.01% of residents moved to foreign countries ($114 average AGI )Nassau County:
0.01%New York average:
0.02%
Top counties to which taxpayers relocated from this county between 2020 and 2021:
Businesses in Farmingdale, NY
Name Count Name Count
7-Eleven 4 Marriott 2 AT&T 2 MasterBrand Cabinets 6 Ace Hardware 1 McDonald's 1 Applebee's 1 New Balance 2 Avenue 1 Nike 2 Bed Bath & Beyond 1 Panera Bread 1 Ben & Jerry's 1 PetSmart 1 Budget Car Rental 1 RadioShack 1 Burger King 1 Raymour & Flanigan 2 CVS 2 Ruby Tuesday 1 Chipotle 1 Ryder Rental & Truck Leasing 1 DHL 1 Staples 1 Decora Cabinetry 1 Starbucks 2 Domino's Pizza 1 Stop & Shop 1 Dunkin Donuts 4 T-Mobile 2 FedEx 10 Taco Bell 1 GNC 1 Target 1 GameStop 1 The Room Place 3 H&R Block 1 True Value 1 Home Depot 1 U-Haul 1 Houlihan's 1 UPS 15 Jones New York 1 Vans 1 Kincaid 1 Verizon Wireless 1 LA Fitness 1 Walmart 1 La-Z-Boy 2 Wendy's 3 Lowe's 1 White Castle 1
Strongest AM radio stations in Farmingdale:
WGSM (740 AM; 25 kW; HUNTINGTON, NY; Owner: K RADIO LICENSEE, INC.)
WFAN (660 AM; 50 kW; NEW YORK, NY; Owner: INFINITY BROADCASTING OPERATIONS, INC.)
WCBS (880 AM; 50 kW; NEW YORK, NY; Owner: INFINITY BROADCASTING OPERATIONS, INC.)
WHLI (1100 AM; daytime; 10 kW; HEMPSTEAD, NY)
WMCA (570 AM; 50 kW; NEW YORK, NY; Owner: SALEM MEDIA OF NEW YORK, LLC)
WOR (710 AM; 50 kW; NEW YORK, NY; Owner: BUCKLEY BROADCASTING CORPORATION)
WABC (770 AM; 50 kW; NEW YORK, NY; Owner: WABC-AM RADIO, INC.)
WQEW (1560 AM; 50 kW; NEW YORK, NY; Owner: THE NEW YORK TIMES ELECTRONIC MEDIA COMPANY)
WBBR (1130 AM; 50 kW; NEW YORK, NY; Owner: BLOOMBERG COMMUNICATIONS INC.)
WEPN (1050 AM; 50 kW; NEW YORK, NY; Owner: NEW YORK AM RADIO, LLC)
WINS (1010 AM; 50 kW; NEW YORK, NY; Owner: INFINITY BROADCASTING OPERATIONS, INC.)
WADO (1280 AM; 50 kW; NEW YORK, NY; Owner: WADO-AM LICENSE CORP.)
WNYG (1440 AM; 1 kW; BABYLON, NY; Owner: MULTICULTURAL RADIO BROADCASTING, INC.)
Strongest FM radio stations in Farmingdale:
W217AF (91.3 FM; HUNTINGTON STATION, NY; Owner: SACRED HEART UNIVERSITY, INC.)
WKWZ (88.5 FM; SYOSSET, NY; Owner: SYOSSET CENTRAL SCHOOL DISTRICT)
WPOB (88.5 FM; PLAINVIEW, NY; Owner: PLAINVIEW-OLD BETHPAGE CENT SCH DIST)
WMJC (94.3 FM; SMITHTOWN, NY; Owner: IW LIMITED LIABILITY COMPANY)
WBAB (102.3 FM; BABYLON, NY; Owner: CXR HOLDINGS, INC.)
WKCR-FM (89.9 FM; NEW YORK, NY; Owner: TRUSTEES OF COLUMBIA UNIVERSITY IN NEW YORK)
WKJY (98.3 FM; HEMPSTEAD, NY; Owner: LONG ISLAND BROADCASTING, INC.)
WBZO (103.1 FM; BAY SHORE, NY; Owner: MID-ISLAND BROADCASTING LIMITED PARTNERSHIP)
WKTU (103.5 FM; LAKE SUCCESS, NY; Owner: AMFM RADIO LICENSES, LLC)
WQCD (101.9 FM; NEW YORK, NY; Owner: EMMIS RADIO LICENSE CORPORATION)
WCAA (105.9 FM; NEWARK, NJ; Owner: WADO-AM LICENSE CORP. ("WADO"))
WALK-FM (97.5 FM; PATCHOGUE, NY; Owner: AMFM RADIO LICENSES, L.L.C.)
WBAI (99.5 FM; NEW YORK, NY; Owner: PACIFICA FOUNDATION, INC.)
WBLS (107.5 FM; NEW YORK, NY; Owner: ICBC BROADCAST HOLDINGS-NY, INC.)
WLTW (106.7 FM; NEW YORK, NY; Owner: AMFM NEW YORK LICENSES, LLC)
WQXR-FM (96.3 FM; NEW YORK, NY; Owner: THE NEW YORK TIMES ELECTRONIC MEDIA COMPANY)
WSKQ-FM (97.9 FM; NEW YORK, NY; Owner: WSKQ LICENSING, INC.)
WXRK (92.3 FM; NEW YORK, NY; Owner: INFINITY BROADCASTING OPERATIONS, INC.)
WAXQ (104.3 FM; NEW YORK, NY; Owner: AMFM NEW YORK LICENSES, LLC)
WHTZ (100.3 FM; NEWARK, NJ; Owner: AMFM RADIO LICENSES, L.L.C.)
TV broadcast stations around Farmingdale:
WLIW (Channel 21; GARDEN CITY, NY; Owner: EDUCATIONAL BROADCASTING CORPORATION)
WNYW (Channel 5; NEW YORK, NY; Owner: FOX TELEVISION STATIONS, INC.)
W27CB (Channel 27; HEMPSTEAD, NY; Owner: K LICENSEE INC.)
WCBS-TV (Channel 2; NEW YORK, NY; Owner: CBS BROADCASTING INC.)
WABC-TV (Channel 7; NEW YORK, NY; Owner: AMERICAN BROADCASTING COMPANIES, INC)
WPIX (Channel 11; NEW YORK, NY; Owner: WPIX, INC.)
WWOR-TV (Channel 9; SECAUCUS, NJ; Owner: FOX TELEVISION STATIONS, INC.)
WXNY-LP (Channel 32; NEW YORK, NY; Owner: ISLAND BROADCASTING COMPANY)
WNJU (Channel 47; LINDEN, NJ; Owner: WNJU LICENSE CORPORATION)
WPXN-TV (Channel 31; NEW YORK, NY; Owner: PAXSON COMMUNICATIONS LICENSE COMPANY, LLC)
WFUT (Channel 68; NEWARK, NJ; Owner: UNIVISION NEW YORK LLC)
WNBC (Channel 4; NEW YORK, NY; Owner: NATIONAL BROADCASTING COMPANY, INC.)
WNET (Channel 13; NEWARK, NJ; Owner: EDUCATIONAL BROADCASTING CORPORATION)
WXTV (Channel 41; PATERSON, NJ; Owner: WXTV LICENSE PARTNERSHIP, G.P.)
WNYE-TV (Channel 25; NEW YORK, NY; Owner: NEW YORK CITY BOARD OF EDUCATION)
WKOB-LP (Channel 53; NEW YORK, NY; Owner: WKOB COMMUNICATIONS, INC.)
WEBR-CA (Channel 17; MANHATTAN, NY; Owner: K LICENSEE INC.)
WRNN-LP (Channel 57; NYACK, NY; Owner: LP NYACK LIMITED PARTNERSHIP)
WPXU-LP (Channel 38; AMITYVILLE, NY; Owner: PAXSON COMMUNICATIONS LPTV, INC.)
WLIG-LP (Channel 54; MINEOLA, NY; Owner: WLNY-TV, INC.)
W60AI (Channel 60; NEW YORK, NY; Owner: VENTANA TELEVISION, INC.)
WNYX-LP (Channel 35; NEW YORK, NY; Owner: ISLAND BROADCASTING COMPANY)
W38CL (Channel 38; BRONX, NY; Owner: RENARD COMMUNICATIONS CORP.)
W33BS (Channel 33; DARIEN, CT; Owner: CT&T BROADCASTING, INC.)
WNYN-LP (Channel 39; NEW YORK, NY; Owner: ISLAND BROADCASTING COMPANY)
National Bridge Inventory (NBI) Statistics 2 Number of bridges36,300 Total average daily traffic
Home Mortgage Disclosure Act Aggregated Statistics For Year 2009(Based on 2 full tracts) A) FHA, FSA/RHS & VA B) Conventional C) Refinancings D) Home Improvement Loans E) Loans on Dwellings For 5+ Families F) Non-occupant Loans on Number Average Value Number Average Value Number Average Value Number Average Value Number Average Value Number Average Value
LOANS ORIGINATED 16 $356,888 49 $218,602 87 $246,076 4 $116,395 1 $299,670 4 $262,620 APPLICATIONS APPROVED, NOT ACCEPTED 0 $0 4 $264,695 22 $276,951 0 $0 0 $0 3 $295,000 APPLICATIONS DENIED 10 $356,941 6 $191,918 50 $283,740 9 $64,996 0 $0 3 $291,867 APPLICATIONS WITHDRAWN 1 $355,610 12 $194,136 32 $282,713 1 $100,000 1 $199,780 1 $309,660 FILES CLOSED FOR INCOMPLETENESS 0 $0 0 $0 5 $421,304 2 $102,940 0 $0 0 $0
Aggregated Statistics For Year 2008(Based on 2 full tracts) A) FHA, FSA/RHS & VA B) Conventional C) Refinancings D) Home Improvement Loans E) Loans on Dwellings For 5+ Families F) Non-occupant Loans on Number Average Value Number Average Value Number Average Value Number Average Value Number Average Value Number Average Value
LOANS ORIGINATED 5 $380,336 77 $253,926 40 $270,916 14 $116,146 3 $3,827,973 8 $294,651 APPLICATIONS APPROVED, NOT ACCEPTED 0 $0 13 $307,379 13 $287,805 2 $8,490 0 $0 2 $345,000 APPLICATIONS DENIED 2 $460,495 17 $270,061 54 $361,152 10 $49,665 0 $0 3 $405,897 APPLICATIONS WITHDRAWN 3 $264,157 11 $298,202 21 $339,123 1 $318,650 0 $0 0 $0 FILES CLOSED FOR INCOMPLETENESS 0 $0 4 $334,320 8 $362,951 1 $250,000 0 $0 1 $232,740
Aggregated Statistics For Year 2007(Based on 2 full tracts) A) FHA, FSA/RHS & VA B) Conventional C) Refinancings D) Home Improvement Loans F) Non-occupant Loans on Number Average Value Number Average Value Number Average Value Number Average Value Number Average Value
LOANS ORIGINATED 3 $398,383 112 $264,562 87 $286,076 13 $135,412 12 $323,958 APPLICATIONS APPROVED, NOT ACCEPTED 0 $0 26 $229,558 25 $185,521 8 $102,472 1 $310,000 APPLICATIONS DENIED 1 $455,000 28 $314,613 62 $283,875 21 $102,905 2 $436,020 APPLICATIONS WITHDRAWN 1 $279,690 11 $357,145 24 $227,888 1 $294,680 0 $0 FILES CLOSED FOR INCOMPLETENESS 0 $0 5 $337,308 10 $317,103 1 $391,570 0 $0
Aggregated Statistics For Year 2006(Based on 2 full tracts) B) Conventional C) Refinancings D) Home Improvement Loans E) Loans on Dwellings For 5+ Families F) Non-occupant Loans on G) Loans On Manufactured Number Average Value Number Average Value Number Average Value Number Average Value Number Average Value Number Average Value
LOANS ORIGINATED 139 $271,747 107 $235,077 27 $147,835 3 $844,747 12 $244,245 0 $0 APPLICATIONS APPROVED, NOT ACCEPTED 16 $340,739 14 $226,500 1 $42,000 0 $0 1 $350,000 0 $0 APPLICATIONS DENIED 32 $333,835 59 $245,152 16 $69,917 0 $0 8 $286,851 0 $0 APPLICATIONS WITHDRAWN 16 $280,095 42 $272,932 2 $54,500 1 $599,340 1 $320,000 1 $217,000 FILES CLOSED FOR INCOMPLETENESS 9 $248,138 14 $319,354 0 $0 0 $0 0 $0 1 $400,000
Aggregated Statistics For Year 2005(Based on 2 full tracts) B) Conventional C) Refinancings D) Home Improvement Loans E) Loans on Dwellings For 5+ Families F) Non-occupant Loans on G) Loans On Manufactured Number Average Value Number Average Value Number Average Value Number Average Value Number Average Value Number Average Value
LOANS ORIGINATED 131 $247,839 127 $231,880 22 $94,703 1 $2,800,000 16 $308,371 0 $0 APPLICATIONS APPROVED, NOT ACCEPTED 16 $280,292 20 $288,518 6 $78,973 0 $0 2 $270,370 0 $0 APPLICATIONS DENIED 32 $260,755 57 $299,734 18 $143,280 0 $0 3 $300,453 2 $242,235 APPLICATIONS WITHDRAWN 8 $380,852 58 $249,602 6 $57,333 0 $0 4 $369,658 2 $97,500 FILES CLOSED FOR INCOMPLETENESS 9 $358,403 25 $265,768 2 $145,000 0 $0 0 $0 0 $0
Aggregated Statistics For Year 2004(Based on 2 full tracts) A) FHA, FSA/RHS & VA B) Conventional C) Refinancings D) Home Improvement Loans F) Non-occupant Loans on Number Average Value Number Average Value Number Average Value Number Average Value Number Average Value
LOANS ORIGINATED 1 $183,000 135 $217,648 146 $200,044 21 $83,029 16 $251,008 APPLICATIONS APPROVED, NOT ACCEPTED 0 $0 15 $253,244 34 $223,920 4 $87,405 5 $263,234 APPLICATIONS DENIED 0 $0 23 $255,408 47 $240,719 11 $121,458 7 $331,234 APPLICATIONS WITHDRAWN 0 $0 15 $255,497 58 $228,832 5 $68,588 1 $428,000 FILES CLOSED FOR INCOMPLETENESS 0 $0 4 $212,430 30 $208,674 3 $137,523 1 $199,780
Aggregated Statistics For Year 2003(Based on 2 full tracts) A) FHA, FSA/RHS & VA B) Conventional C) Refinancings D) Home Improvement Loans E) Loans on Dwellings For 5+ Families F) Non-occupant Loans on Number Average Value Number Average Value Number Average Value Number Average Value Number Average Value Number Average Value
LOANS ORIGINATED 2 $245,500 158 $194,523 375 $173,104 16 $50,480 1 $149,840 26 $218,868 APPLICATIONS APPROVED, NOT ACCEPTED 0 $0 16 $253,326 47 $199,355 4 $38,708 0 $0 0 $0 APPLICATIONS DENIED 2 $208,770 27 $182,549 86 $202,145 12 $43,396 0 $0 12 $231,226 APPLICATIONS WITHDRAWN 0 $0 9 $163,717 85 $188,143 5 $38,596 0 $0 6 $218,760 FILES CLOSED FOR INCOMPLETENESS 0 $0 3 $198,483 21 $195,219 3 $43,297 0 $0 0 $0
Aggregated Statistics For Year 2002(Based on 2 full tracts) A) FHA, FSA/RHS & VA B) Conventional C) Refinancings D) Home Improvement Loans E) Loans on Dwellings For 5+ Families F) Non-occupant Loans on Number Average Value Number Average Value Number Average Value Number Average Value Number Average Value Number Average Value
LOANS ORIGINATED 1 $229,750 123 $151,820 206 $161,465 14 $66,739 1 $1,125,000 12 $227,925 APPLICATIONS APPROVED, NOT ACCEPTED 0 $0 13 $138,947 37 $143,335 7 $48,244 0 $0 3 $161,827 APPLICATIONS DENIED 1 $224,000 15 $191,911 42 $168,808 10 $40,365 1 $129,860 1 $199,780 APPLICATIONS WITHDRAWN 1 $149,840 3 $134,277 53 $163,807 4 $54,982 0 $0 5 $173,124 FILES CLOSED FOR INCOMPLETENESS 0 $0 5 $185,430 18 $151,807 0 $0 0 $0 2 $187,960
Aggregated Statistics For Year 2001(Based on 2 full tracts) A) FHA, FSA/RHS & VA B) Conventional C) Refinancings D) Home Improvement Loans E) Loans on Dwellings For 5+ Families F) Non-occupant Loans on Number Average Value Number Average Value Number Average Value Number Average Value Number Average Value Number Average Value
LOANS ORIGINATED 7 $186,857 104 $151,469 149 $142,254 20 $76,156 1 $300,000 11 $162,961 APPLICATIONS APPROVED, NOT ACCEPTED 0 $0 8 $139,766 28 $124,051 4 $39,482 0 $0 0 $0 APPLICATIONS DENIED 0 $0 18 $97,571 58 $131,242 7 $27,279 0 $0 4 $140,722 APPLICATIONS WITHDRAWN 0 $0 10 $135,777 40 $126,662 4 $43,735 0 $0 4 $144,250 FILES CLOSED FOR INCOMPLETENESS 0 $0 2 $71,940 11 $133,632 0 $0 0 $0 1 $110,000
Aggregated Statistics For Year 2000(Based on 2 full tracts) A) FHA, FSA/RHS & VA B) Conventional C) Refinancings D) Home Improvement Loans E) Loans on Dwellings For 5+ Families F) Non-occupant Loans on Number Average Value Number Average Value Number Average Value Number Average Value Number Average Value Number Average Value
LOANS ORIGINATED 3 $169,917 116 $123,836 45 $124,367 20 $40,422 3 $675,000 6 $122,970 APPLICATIONS APPROVED, NOT ACCEPTED 0 $0 11 $147,449 15 $90,223 10 $32,379 0 $0 3 $112,990 APPLICATIONS DENIED 3 $168,273 25 $131,968 34 $97,326 13 $50,748 1 $1,540,000 4 $180,875 APPLICATIONS WITHDRAWN 1 $166,000 13 $136,907 48 $102,443 6 $37,807 0 $0 4 $133,875 FILES CLOSED FOR INCOMPLETENESS 1 $168,810 4 $103,500 4 $159,372 4 $33,232 0 $0 0 $0
Aggregated Statistics For Year 1999(Based on 2 full tracts) A) FHA, FSA/RHS & VA B) Conventional C) Refinancings D) Home Improvement Loans E) Loans on Dwellings For 5+ Families F) Non-occupant Loans on Number Average Value Number Average Value Number Average Value Number Average Value Number Average Value Number Average Value
LOANS ORIGINATED 6 $169,407 88 $133,403 79 $122,418 20 $26,110 2 $1,195,390 2 $92,375 APPLICATIONS APPROVED, NOT ACCEPTED 0 $0 5 $104,836 20 $135,058 5 $44,882 0 $0 0 $0 APPLICATIONS DENIED 1 $182,100 14 $118,654 36 $103,118 12 $29,971 1 $1,354,220 0 $0 APPLICATIONS WITHDRAWN 0 $0 12 $144,975 34 $97,095 9 $73,627 0 $0 0 $0 FILES CLOSED FOR INCOMPLETENESS 1 $139,930 0 $0 6 $128,627 0 $0 0 $0 1 $112,130
Detailed HMDA statistics for the following Tracts:
5204.01
, 5204.02
Private Mortgage Insurance Companies Aggregated Statistics For Year 2009(Based on 2 full tracts) A) Conventional B) Refinancings Number Average Value Number Average Value
LOANS ORIGINATED 8 $249,238 1 $321,000 APPLICATIONS APPROVED, NOT ACCEPTED 8 $247,248 0 $0 APPLICATIONS DENIED 5 $331,760 2 $359,815 APPLICATIONS WITHDRAWN 3 $311,263 0 $0 FILES CLOSED FOR INCOMPLETENESS 1 $360,600 0 $0
Aggregated Statistics For Year 2008(Based on 2 full tracts) A) Conventional B) Refinancings Number Average Value Number Average Value
LOANS ORIGINATED 31 $244,574 2 $363,100 APPLICATIONS APPROVED, NOT ACCEPTED 5 $332,142 1 $518,430 APPLICATIONS DENIED 4 $216,250 0 $0 APPLICATIONS WITHDRAWN 3 $230,667 0 $0 FILES CLOSED FOR INCOMPLETENESS 1 $162,000 0 $0
Aggregated Statistics For Year 2007(Based on 2 full tracts) A) Conventional B) Refinancings Number Average Value Number Average Value
LOANS ORIGINATED 22 $258,391 5 $399,124 APPLICATIONS APPROVED, NOT ACCEPTED 6 $341,342 0 $0 APPLICATIONS DENIED 1 $153,000 0 $0 APPLICATIONS WITHDRAWN 0 $0 0 $0 FILES CLOSED FOR INCOMPLETENESS 0 $0 0 $0
Aggregated Statistics For Year 2006(Based on 2 full tracts) A) Conventional C) Non-occupant Loans on Number Average Value Number Average Value
LOANS ORIGINATED 10 $279,956 1 $379,580 APPLICATIONS APPROVED, NOT ACCEPTED 0 $0 0 $0 APPLICATIONS DENIED 0 $0 0 $0 APPLICATIONS WITHDRAWN 0 $0 0 $0 FILES CLOSED FOR INCOMPLETENESS 0 $0 0 $0
Aggregated Statistics For Year 2005(Based on 2 full tracts) A) Conventional B) Refinancings Number Average Value Number Average Value
LOANS ORIGINATED 16 $205,546 0 $0 APPLICATIONS APPROVED, NOT ACCEPTED 5 $179,748 1 $390,000 APPLICATIONS DENIED 1 $347,000 0 $0 APPLICATIONS WITHDRAWN 0 $0 1 $319,650 FILES CLOSED FOR INCOMPLETENESS 0 $0 0 $0
Aggregated Statistics For Year 2004(Based on 2 full tracts) A) Conventional B) Refinancings C) Non-occupant Loans on Number Average Value Number Average Value Number Average Value
LOANS ORIGINATED 21 $205,253 1 $301,670 0 $0 APPLICATIONS APPROVED, NOT ACCEPTED 7 $287,279 2 $279,360 1 $311,660 APPLICATIONS DENIED 1 $125,860 0 $0 0 $0 APPLICATIONS WITHDRAWN 0 $0 0 $0 0 $0 FILES CLOSED FOR INCOMPLETENESS 0 $0 0 $0 0 $0
Aggregated Statistics For Year 2003(Based on 2 full tracts) A) Conventional B) Refinancings C) Non-occupant Loans on Number Average Value Number Average Value Number Average Value
LOANS ORIGINATED 34 $214,674 4 $261,790 1 $293,000 APPLICATIONS APPROVED, NOT ACCEPTED 7 $230,403 3 $360,477 0 $0 APPLICATIONS DENIED 0 $0 0 $0 0 $0 APPLICATIONS WITHDRAWN 2 $182,435 2 $283,000 0 $0 FILES CLOSED FOR INCOMPLETENESS 0 $0 0 $0 0 $0
Aggregated Statistics For Year 2002(Based on 2 full tracts) A) Conventional B) Refinancings Number Average Value Number Average Value
LOANS ORIGINATED 33 $149,289 3 $169,257 APPLICATIONS APPROVED, NOT ACCEPTED 18 $139,828 2 $204,375 APPLICATIONS DENIED 1 $186,000 0 $0 APPLICATIONS WITHDRAWN 1 $223,750 0 $0 FILES CLOSED FOR INCOMPLETENESS 0 $0 0 $0
Aggregated Statistics For Year 2001(Based on 2 full tracts) A) Conventional B) Refinancings C) Non-occupant Loans on Number Average Value Number Average Value Number Average Value
LOANS ORIGINATED 49 $157,632 7 $251,043 0 $0 APPLICATIONS APPROVED, NOT ACCEPTED 17 $154,178 1 $353,610 4 $218,312 APPLICATIONS DENIED 1 $68,000 0 $0 0 $0 APPLICATIONS WITHDRAWN 0 $0 2 $286,295 0 $0 FILES CLOSED FOR INCOMPLETENESS 1 $161,820 0 $0 0 $0
Aggregated Statistics For Year 2000(Based on 2 full tracts) A) Conventional B) Refinancings Number Average Value Number Average Value
LOANS ORIGINATED 27 $133,306 2 $231,500 APPLICATIONS APPROVED, NOT ACCEPTED 4 $136,962 0 $0 APPLICATIONS DENIED 2 $106,000 0 $0 APPLICATIONS WITHDRAWN 1 $158,000 0 $0 FILES CLOSED FOR INCOMPLETENESS 0 $0 0 $0
Aggregated Statistics For Year 1999(Based on 2 full tracts) A) Conventional B) Refinancings C) Non-occupant Loans on Number Average Value Number Average Value Number Average Value
LOANS ORIGINATED 27 $130,656 7 $150,447 1 $126,720 APPLICATIONS APPROVED, NOT ACCEPTED 2 $171,075 5 $178,418 0 $0 APPLICATIONS DENIED 0 $0 0 $0 0 $0 APPLICATIONS WITHDRAWN 0 $0 1 $141,230 0 $0 FILES CLOSED FOR INCOMPLETENESS 1 $119,800 0 $0 0 $0
Detailed PMIC statistics for the following Tracts:
5204.01
, 5204.02 Fire-safe hotels and motels in Farmingdale, New York:
Broadway Motor Inn, 727 Broadhollow Rd, Farmingdale, New York 11735 Phone: (516) 249-2810
Courtyard By Marriott, 2 Marriott Plz, Farmingdale, New York 11735 Phone: (631) 927-6900, Fax: (631) 847-0012
Towneplace Suites, 1 Marriott Plz, Farmingdale, New York 11735 Phone: (631) 927-6900, Fax: (631) 454-0060
All 3 fire-safe hotels and motels in Farmingdale, New York
Most common first names in Farmingdale, NY among deceased individuals Name Count Lived (average)
John 288 73.5 years Mary 250 80.5 years Joseph 220 74.2 years William 183 75.6 years Anna 148 83.5 years Frank 147 76.3 years George 133 75.6 years Margaret 132 78.2 years Charles 127 75.5 years James 121 71.7 years
Most common last names in Farmingdale, NY among deceased individuals Last name Count Lived (average)
Smith 51 76.1 years Miller 29 78.4 years Johnson 20 76.4 years Kelly 19 74.5 years Brown 19 75.5 years Sullivan 17 79.4 years Russo 16 77.6 years Wagner 15 83.5 years Schmidt 13 77.7 years Marino 13 72.9 years
Farmingdale compared to New York state average:
Median household income above state average. Unemployed percentage significantly below state average. Black race population percentage significantly below state average. Foreign-born population percentage below state average. Length of stay since moving in significantly above state average. Percentage of population with a bachelor's degree or higher above state average. Farmingdale on our top lists :
#19 on the list of "Top 101 cities with the most residents born in Indonesia (population 500+)"
#31 on the list of "Top 101 cities with the most residents born in Other Southern Europe (population 500+)"
#97 on the list of "Top 101 cities with largest percentage of males in occupations: healthcare support occupations (population 5,000+)"
#99 on the list of "Top 101 cities with the most residents born in Bangladesh (population 500+)"
#8 on the list of "Top 101 counties with the most Orthodox adherents"
#9 on the list of "Top 101 counties with the most Catholic adherents"
#11 on the list of "Top 101 counties with the lowest percentage of residents that keep firearms around their homes"
#13 on the list of "Top 101 counties with the highest ground withdrawal of fresh water for public supply"
#13 on the list of "Top 101 counties with the most Orthodox congregations"
Top Patent Applicants
Erdem Bala (38)
Thomas Mammone (31)
Guodong Zhang (23)
Moon-Il Lee (12)
Allan Katz (7)
Paul H. Marotta (6)
Kam W. Siu (6)
James A. Porter (5)
James Porter (4)
Rafael Avila (4)
Total of 240 patent applications in 2008-2024.
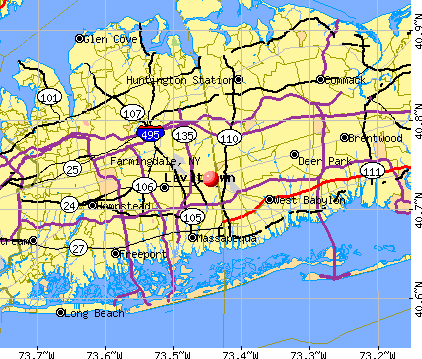


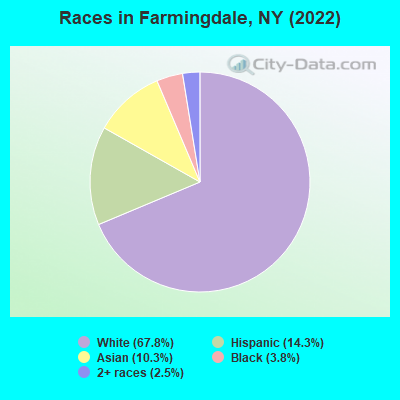
 Recent articles from our blog. Our writers, many of them Ph.D. graduates or candidates, create easy-to-read articles on a wide variety of topics.


 (3.5 miles
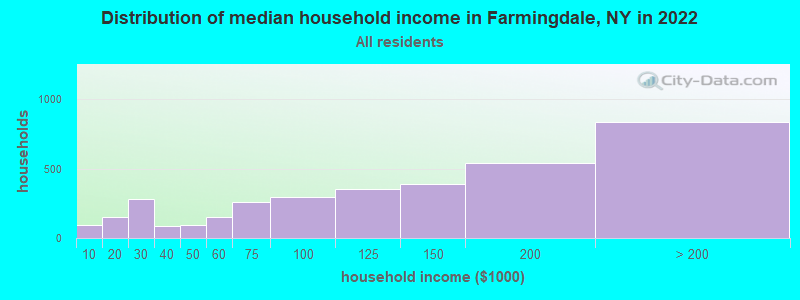
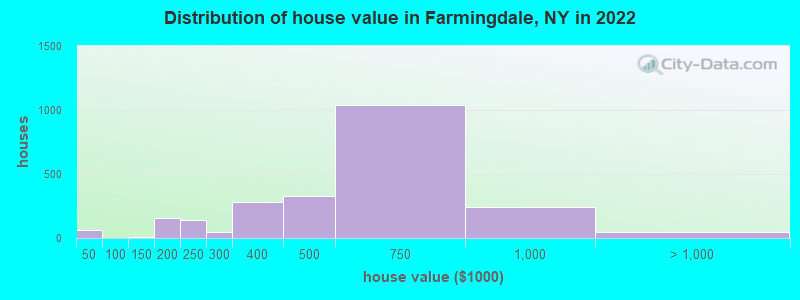

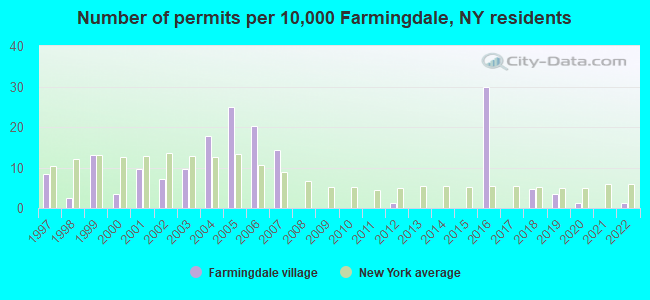
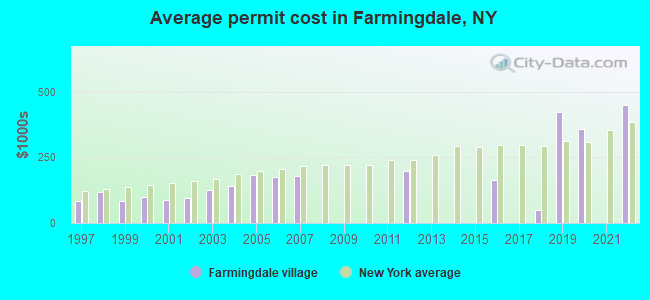
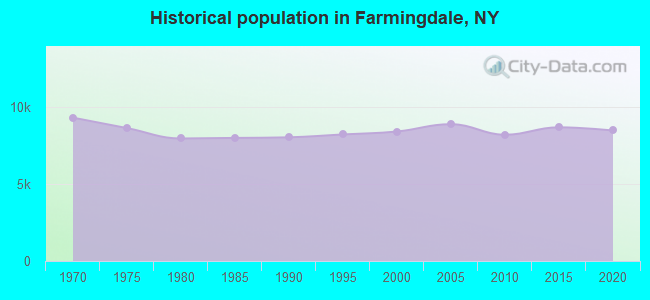
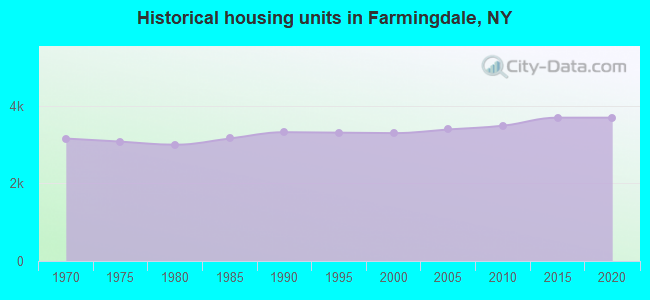
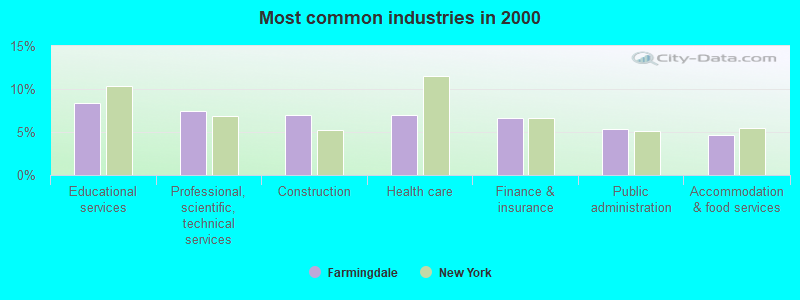

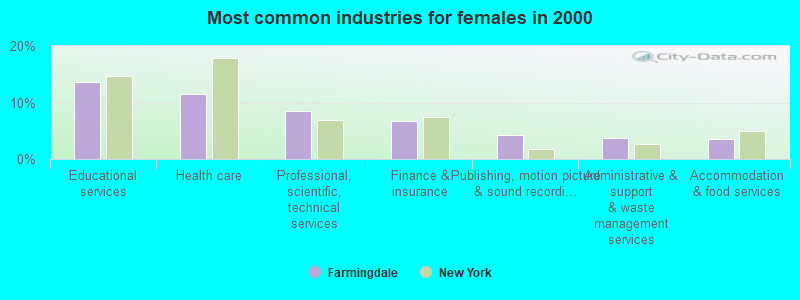
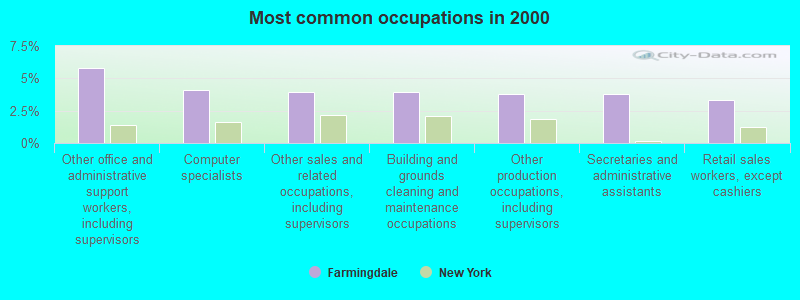
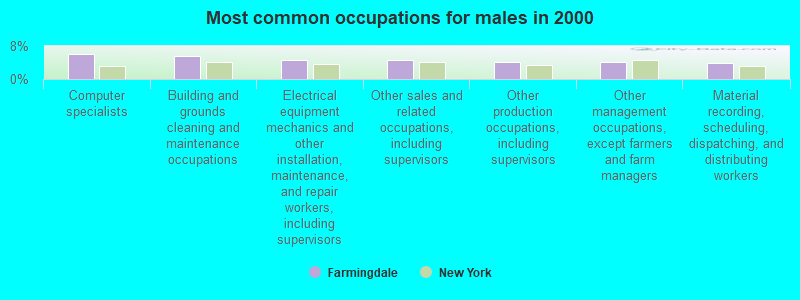
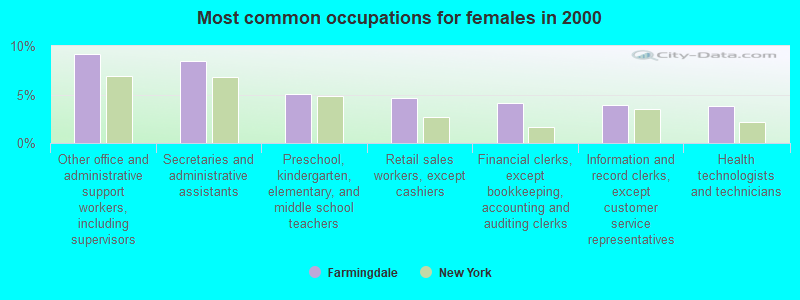

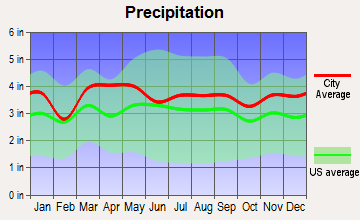
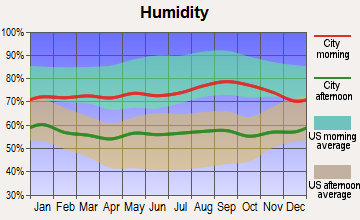
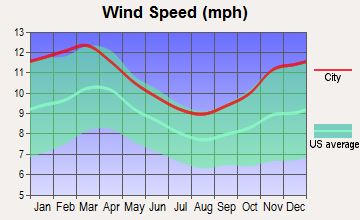
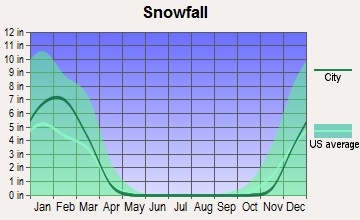
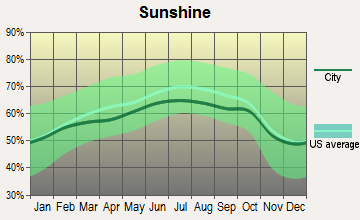
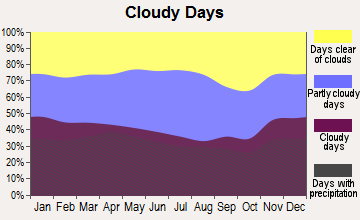


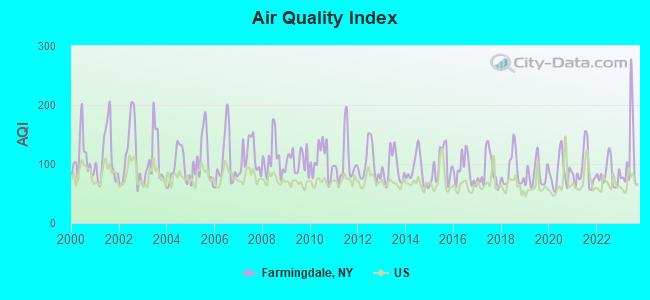
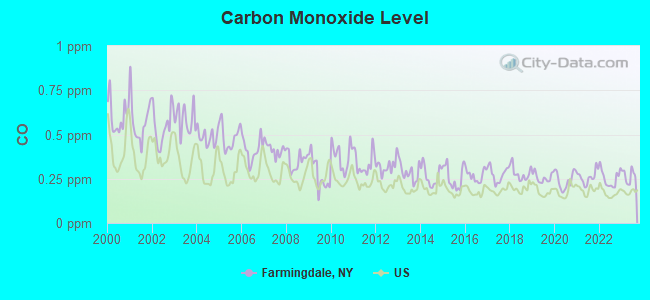
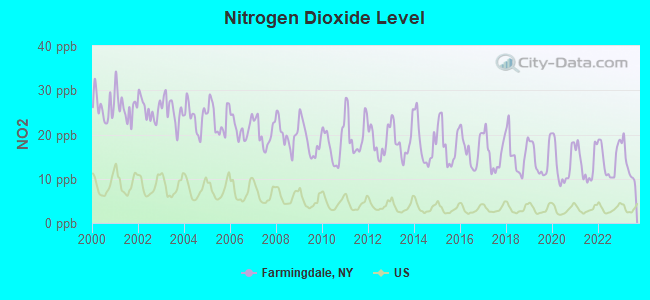
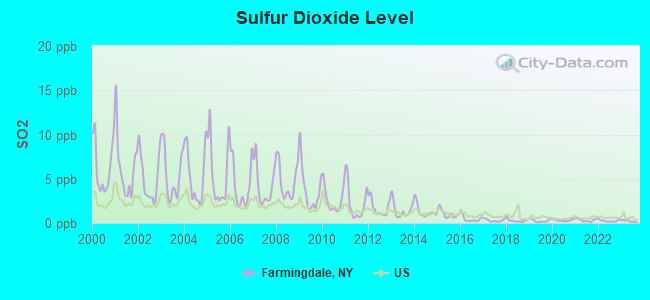
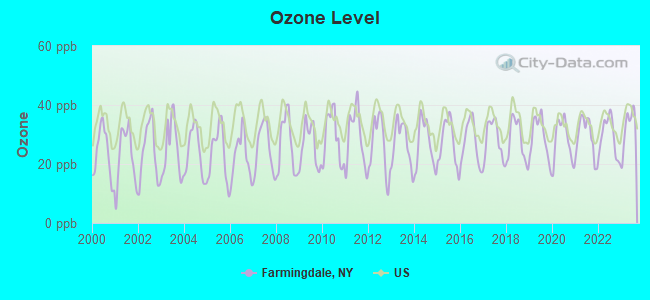
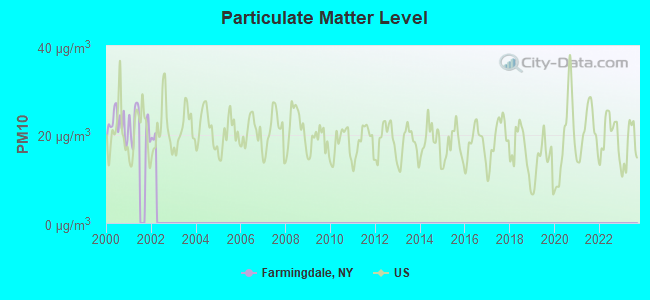
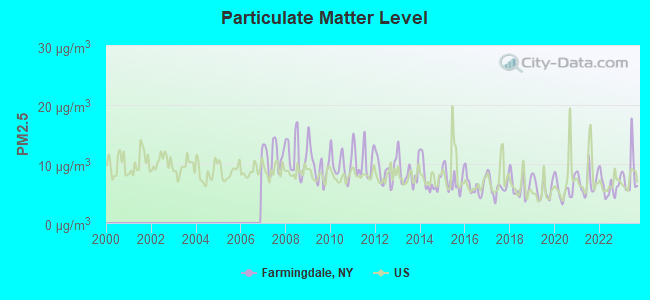

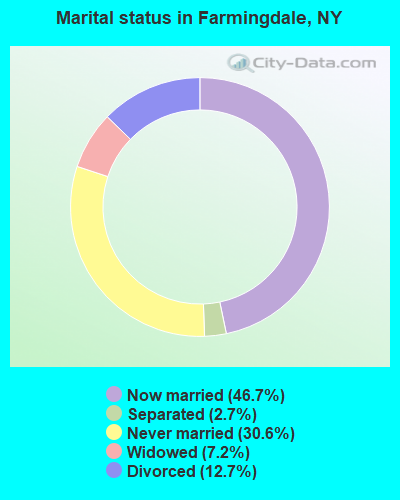
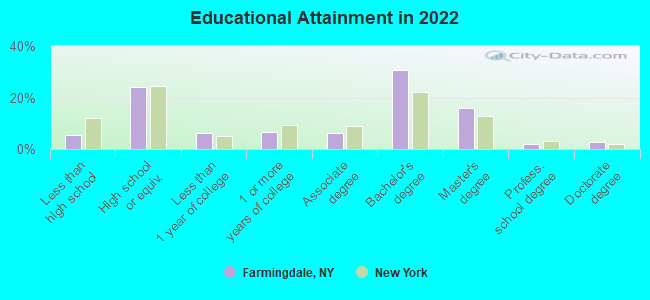
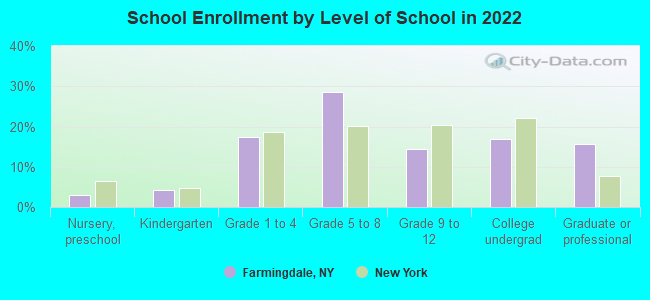
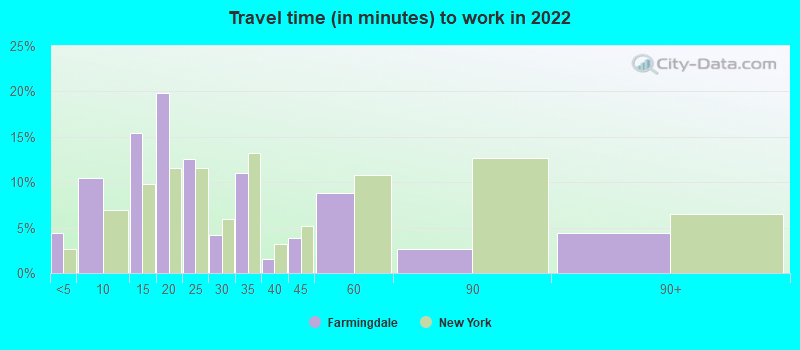
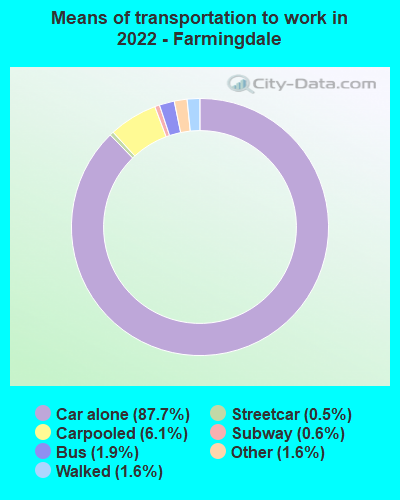
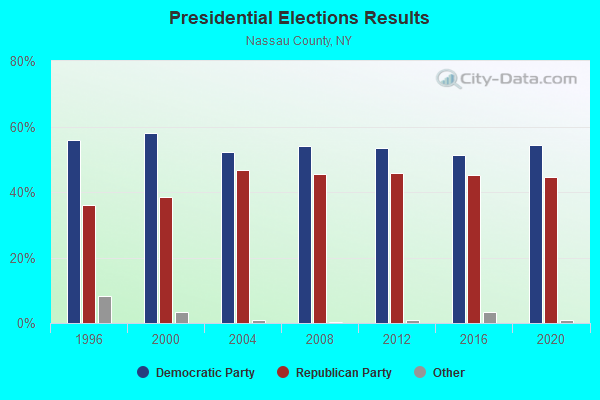
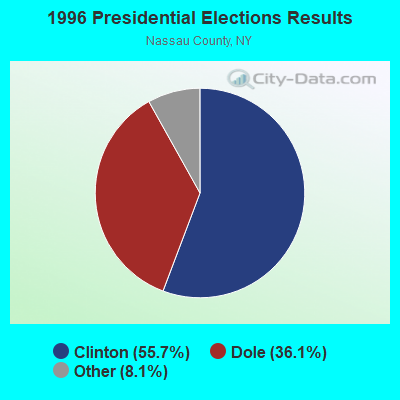
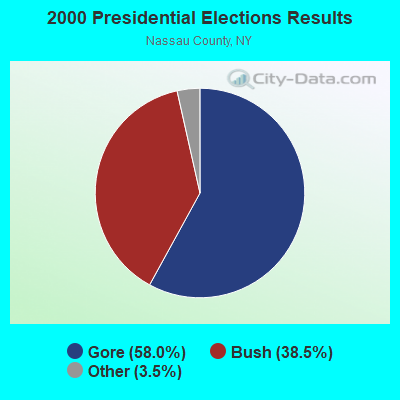
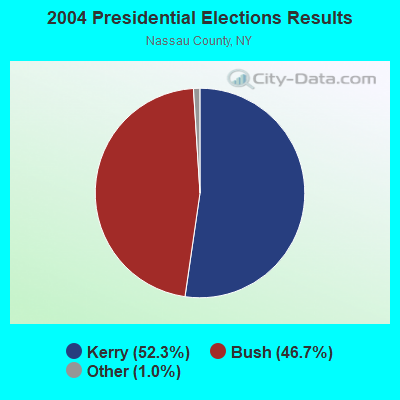
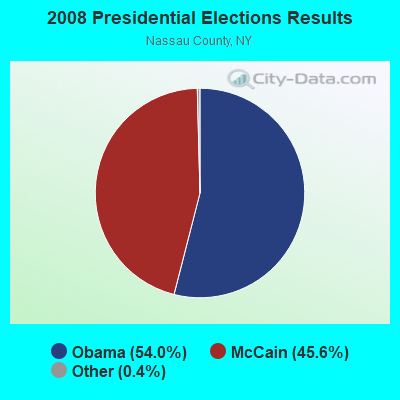
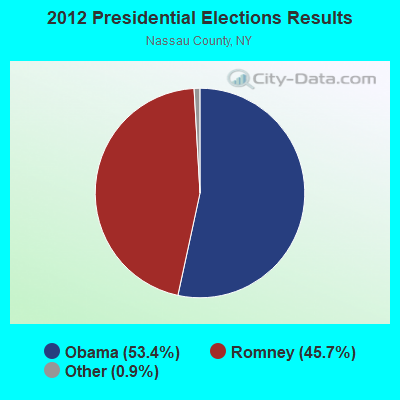
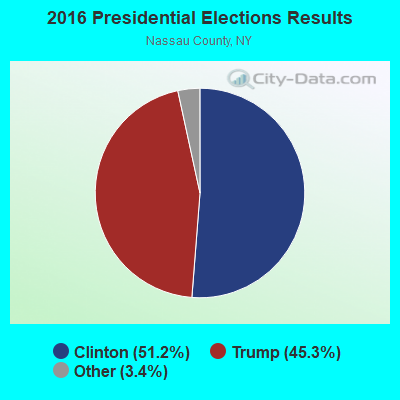
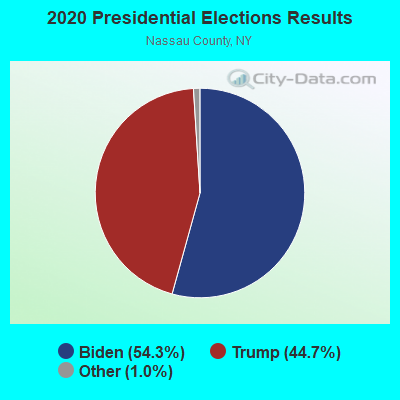
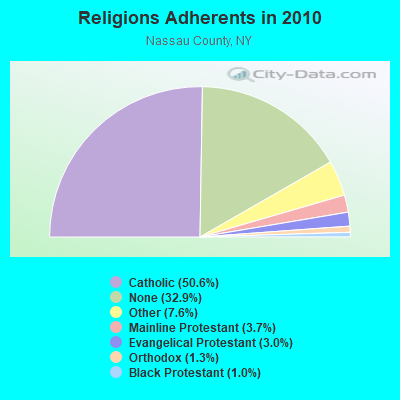
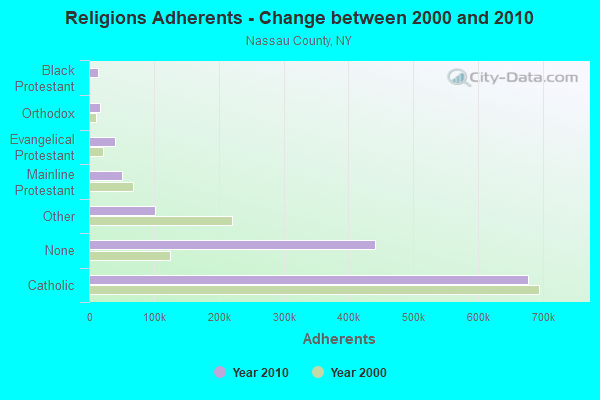
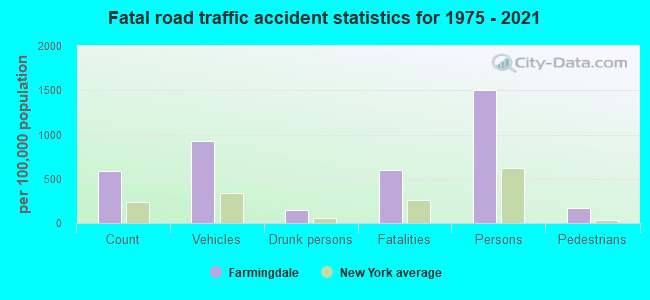
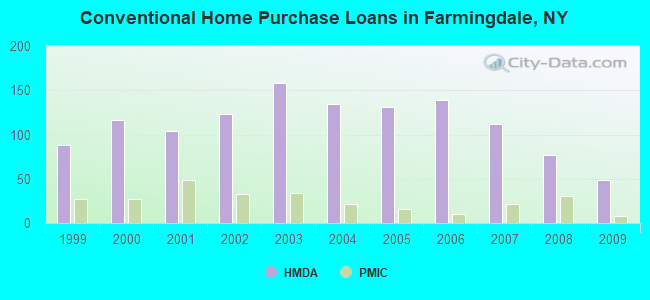
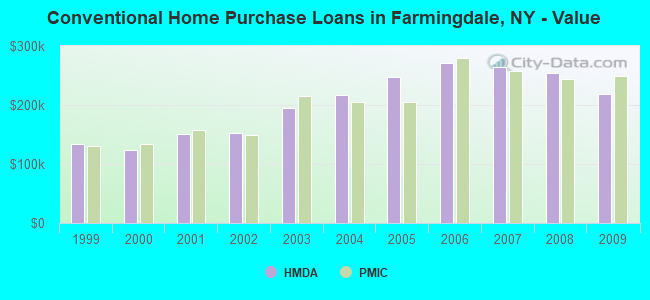
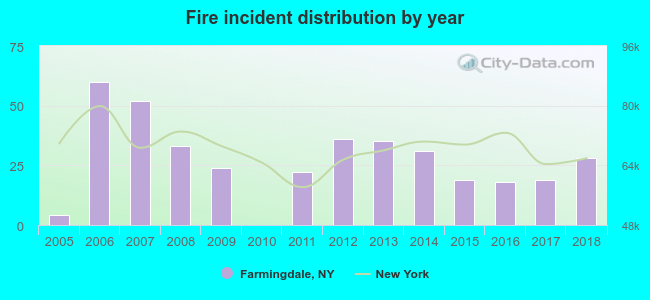 According to the data from the years 2005 - 2018 the average number of fire incidents per year is 27. The highest number of reported fires - 60 took place in 2006, and the least - 0 in 2010. The data has a growing trend.
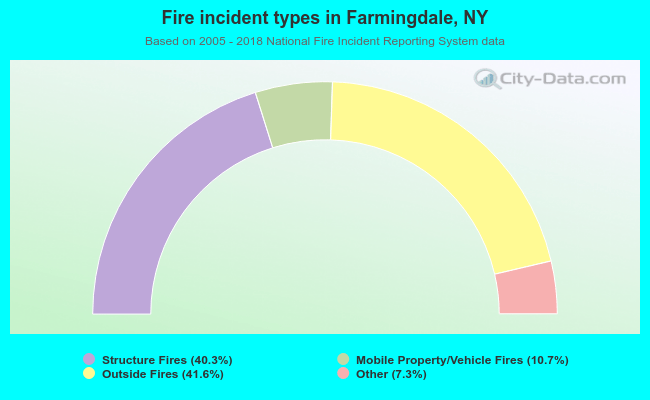 When looking into fire subcategories, the most reports belonged to: Outside Fires (41.6%), and Structure Fires (40.3%).